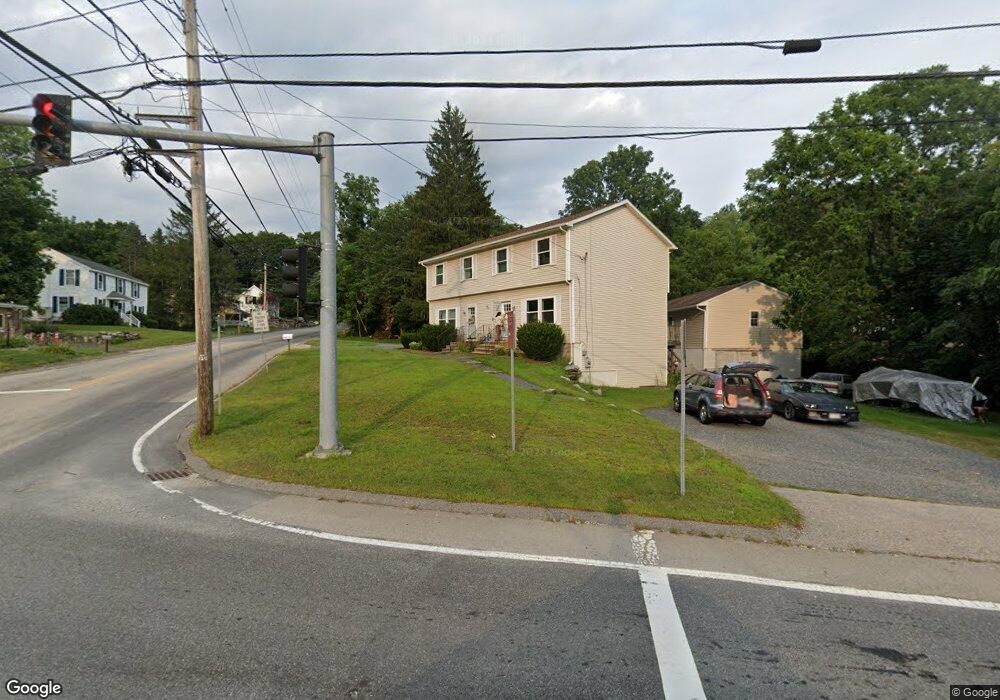
37 Providence Rd Grafton, MA 01519
Estimated Value: $620,868 - $786,000
3
Beds
3
Baths
1,872
Sq Ft
$355/Sq Ft
Est. Value
About This Home
This home is located at 37 Providence Rd, Grafton, MA 01519 and is currently estimated at $664,467, approximately $354 per square foot. 37 Providence Rd is a home located in Worcester County with nearby schools including Grafton High School, Silver Spruce Montessori School, and Touchstone Community School.
Ownership History
Date
Name
Owned For
Owner Type
Purchase Details
Closed on
Jun 22, 2007
Sold by
Tenney Lauri F
Bought by
Spargo Anne M and Spargo Curtis W
Current Estimated Value
Home Financials for this Owner
Home Financials are based on the most recent Mortgage that was taken out on this home.
Original Mortgage
$258,000
Interest Rate
6.14%
Mortgage Type
Purchase Money Mortgage
Purchase Details
Closed on
Feb 2, 2004
Sold by
Tenney Robert F and Tenney Robert
Bought by
Tenney Lauri F
Purchase Details
Closed on
Jul 23, 1999
Sold by
Knapik Bldrs Inc
Bought by
Tenney Robert F and Tenney Lauri F
Home Financials for this Owner
Home Financials are based on the most recent Mortgage that was taken out on this home.
Original Mortgage
$168,750
Interest Rate
7.49%
Mortgage Type
Purchase Money Mortgage
Create a Home Valuation Report for This Property
The Home Valuation Report is an in-depth analysis detailing your home's value as well as a comparison with similar homes in the area
Home Values in the Area
Average Home Value in this Area
Purchase History
| Date | Buyer | Sale Price | Title Company |
|---|---|---|---|
| Spargo Anne M | $344,000 | -- | |
| Spargo Anne M | $344,000 | -- | |
| Spargo Anne M | $344,000 | -- | |
| Tenney Lauri F | -- | -- | |
| Tenney Lauri F | -- | -- | |
| Tenney Lauri F | -- | -- | |
| Tenney Robert F | $210,954 | -- |
Source: Public Records
Mortgage History
| Date | Status | Borrower | Loan Amount |
|---|---|---|---|
| Open | Tenney Robert F | $249,050 | |
| Closed | Spargo Anne M | $258,000 | |
| Previous Owner | Tenney Robert F | $168,750 | |
| Closed | Tenney Robert F | $16,250 |
Source: Public Records
Tax History Compared to Growth
Tax History
| Year | Tax Paid | Tax Assessment Tax Assessment Total Assessment is a certain percentage of the fair market value that is determined by local assessors to be the total taxable value of land and additions on the property. | Land | Improvement |
|---|---|---|---|---|
| 2025 | $7,366 | $528,400 | $156,900 | $371,500 |
| 2024 | $7,224 | $504,800 | $149,400 | $355,400 |
| 2023 | $6,837 | $435,200 | $149,400 | $285,800 |
| 2022 | $6,448 | $382,000 | $128,300 | $253,700 |
| 2021 | $6,217 | $361,900 | $116,500 | $245,400 |
| 2020 | $5,930 | $359,400 | $116,500 | $242,900 |
| 2019 | $5,639 | $338,500 | $91,900 | $246,600 |
| 2018 | $5,277 | $318,100 | $90,900 | $227,200 |
| 2017 | $4,931 | $300,700 | $73,500 | $227,200 |
| 2016 | $5,519 | $329,500 | $86,900 | $242,600 |
| 2015 | $5,457 | $330,700 | $85,800 | $244,900 |
| 2014 | $4,978 | $326,200 | $95,800 | $230,400 |
Source: Public Records
Map
Nearby Homes