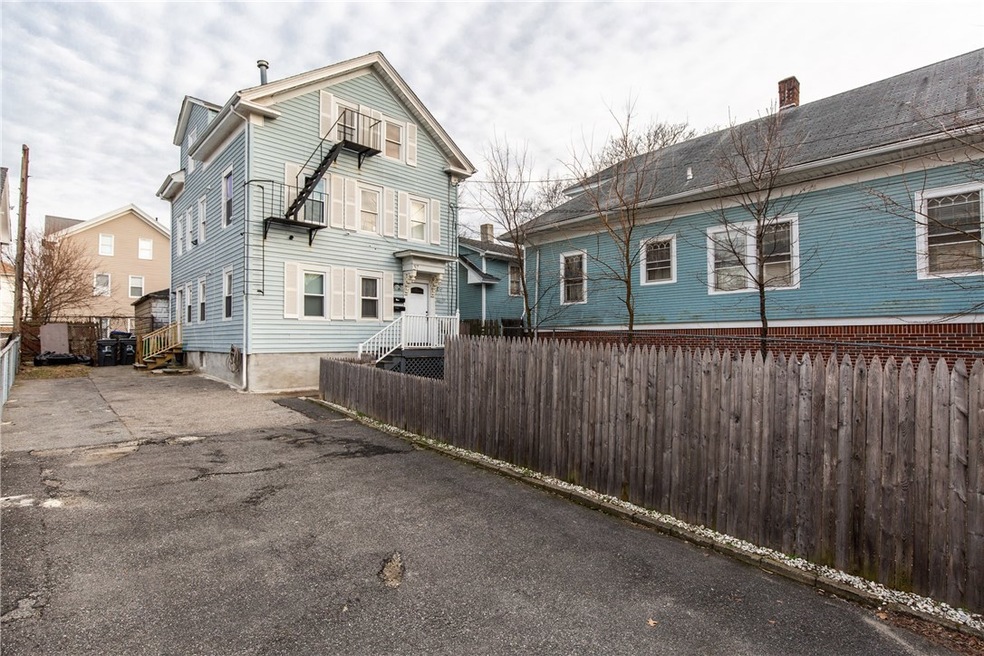
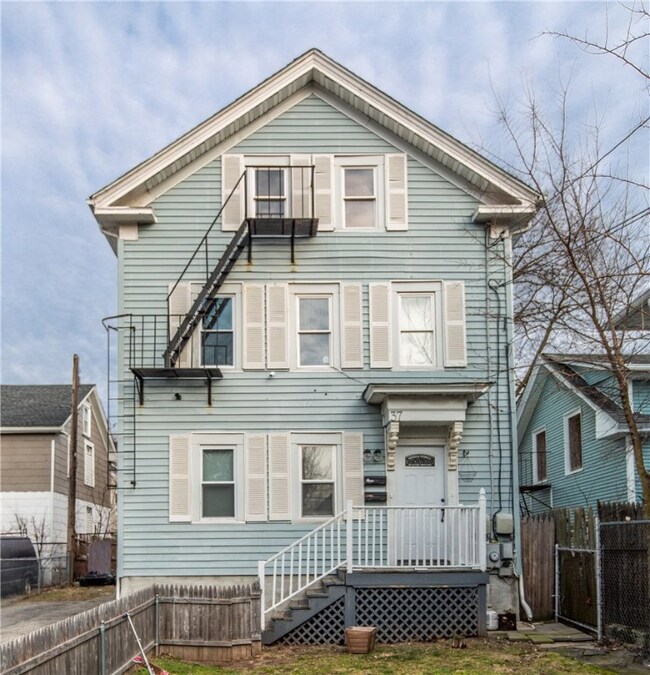
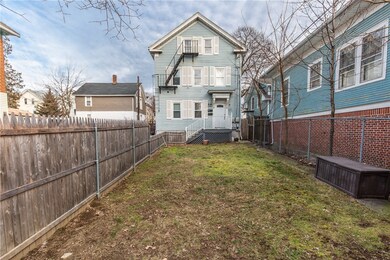
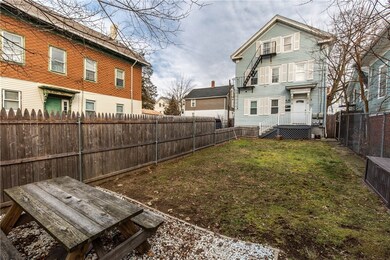
37 Putnam St Providence, RI 02909
Olneyville NeighborhoodHighlights
- Deck
- Public Transportation
- Forced Air Heating System
- Porch
- Shops
- 4-minute walk to Joslin Park & Playground
About This Home
As of June 2020This home is located at 37 Putnam St, Providence, RI 02909 and is currently priced at $238,000, approximately $79 per square foot. This property was built in 1900. 37 Putnam St is a home located in Providence County with nearby schools including Asa Messer Elementary School, Charles N. Fortes Elementary School, and Laurel Hill Annex School.
Last Agent to Sell the Property
Anytime Team
Anytime Realty

Property Details
Home Type
- Multi-Family
Est. Annual Taxes
- $2,770
Year Built
- Built in 1900
Lot Details
- 3,920 Sq Ft Lot
Home Design
- Vinyl Siding
Interior Spaces
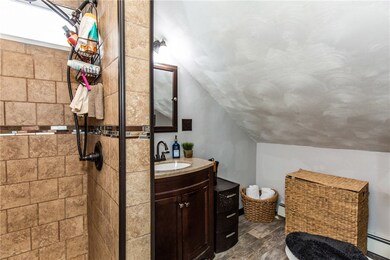
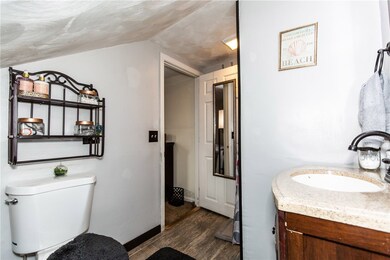
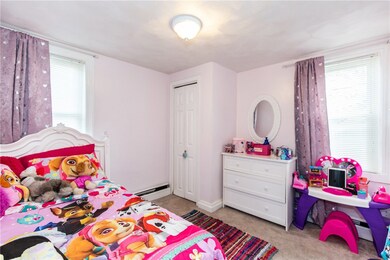
- 3,000 Sq Ft Home
- 3-Story Property
Kitchen
- Oven
- Range
Flooring
- Carpet
- Laminate
Bedrooms and Bathrooms
- 7 Bedrooms
- 3 Full Bathrooms
Laundry
- Dryer
- Washer
Unfinished Basement
- Basement Fills Entire Space Under The House
- Interior Basement Entry
Parking
- 4 Parking Spaces
- No Garage
Outdoor Features
- Deck
- Porch
Utilities
- No Cooling
- Forced Air Heating System
- Heating System Uses Gas
- Heating System Uses Steam
- 100 Amp Service
- Gas Water Heater
Listing and Financial Details
- Tax Lot 148
- Assessor Parcel Number 37PUTNAMSTPROV
Community Details
Overview
- 2 Units
Amenities
- Shops
- Public Transportation
Ownership History
Purchase Details
Home Financials for this Owner
Home Financials are based on the most recent Mortgage that was taken out on this home.Purchase Details
Home Financials for this Owner
Home Financials are based on the most recent Mortgage that was taken out on this home.Purchase Details
Home Financials for this Owner
Home Financials are based on the most recent Mortgage that was taken out on this home.Purchase Details
Home Financials for this Owner
Home Financials are based on the most recent Mortgage that was taken out on this home.Purchase Details
Home Financials for this Owner
Home Financials are based on the most recent Mortgage that was taken out on this home.Map
Home Values in the Area
Average Home Value in this Area
Purchase History
| Date | Type | Sale Price | Title Company |
|---|---|---|---|
| Warranty Deed | $238,000 | None Available | |
| Warranty Deed | $55,000 | -- | |
| Warranty Deed | $55,000 | -- | |
| Quit Claim Deed | -- | -- | |
| Foreclosure Deed | $45,000 | -- |
Mortgage History
| Date | Status | Loan Amount | Loan Type |
|---|---|---|---|
| Open | $233,689 | FHA | |
| Closed | $9,500 | Purchase Money Mortgage | |
| Previous Owner | $117,727 | FHA | |
| Previous Owner | $60,000 | New Conventional | |
| Previous Owner | $50,000 | New Conventional | |
| Previous Owner | $28,000 | New Conventional | |
| Previous Owner | $169,000 | No Value Available | |
| Previous Owner | $142,500 | No Value Available |
Property History
| Date | Event | Price | Change | Sq Ft Price |
|---|---|---|---|---|
| 06/26/2020 06/26/20 | Sold | $238,000 | -2.9% | $79 / Sq Ft |
| 05/27/2020 05/27/20 | Pending | -- | -- | -- |
| 02/10/2020 02/10/20 | For Sale | $244,999 | +104.3% | $82 / Sq Ft |
| 02/26/2016 02/26/16 | Sold | $119,900 | -6.3% | $63 / Sq Ft |
| 01/27/2016 01/27/16 | Pending | -- | -- | -- |
| 07/14/2015 07/14/15 | For Sale | $128,000 | +132.7% | $67 / Sq Ft |
| 01/13/2015 01/13/15 | Sold | $55,000 | -21.3% | $29 / Sq Ft |
| 12/14/2014 12/14/14 | Pending | -- | -- | -- |
| 10/16/2014 10/16/14 | For Sale | $69,900 | +94.2% | $37 / Sq Ft |
| 04/11/2013 04/11/13 | Sold | $36,000 | -27.9% | $18 / Sq Ft |
| 03/12/2013 03/12/13 | Pending | -- | -- | -- |
| 05/08/2012 05/08/12 | For Sale | $49,900 | -- | $25 / Sq Ft |
Tax History
| Year | Tax Paid | Tax Assessment Tax Assessment Total Assessment is a certain percentage of the fair market value that is determined by local assessors to be the total taxable value of land and additions on the property. | Land | Improvement |
|---|---|---|---|---|
| 2024 | $5,356 | $291,900 | $71,800 | $220,100 |
| 2023 | $5,356 | $291,900 | $71,800 | $220,100 |
| 2022 | $5,196 | $291,900 | $71,800 | $220,100 |
| 2021 | $4,615 | $187,900 | $33,500 | $154,400 |
| 2020 | $4,615 | $187,900 | $33,500 | $154,400 |
| 2019 | $4,615 | $187,900 | $33,500 | $154,400 |
| 2018 | $3,522 | $110,200 | $27,600 | $82,600 |
| 2017 | $3,522 | $110,200 | $27,600 | $82,600 |
| 2016 | $3,084 | $96,500 | $27,600 | $68,900 |
| 2015 | $2,588 | $78,200 | $33,200 | $45,000 |
| 2014 | $2,639 | $78,200 | $33,200 | $45,000 |
| 2013 | $2,639 | $78,200 | $33,200 | $45,000 |
Source: State-Wide MLS
MLS Number: 1246949
APN: PROV-620148-000000-000000
Disclaimer: Certain information contained herein is derived from information provided by parties other than Homes.com. All information provided is deemed reliable, but is not guaranteed to be accurate and should be independently verified.
![]() IDX information is provided exclusively for personal, non-commercial use, and may not be used for any purpose other than to identify prospective properties consumers may be interested in purchasing. Information is deemed reliable but not guaranteed.
IDX information is provided exclusively for personal, non-commercial use, and may not be used for any purpose other than to identify prospective properties consumers may be interested in purchasing. Information is deemed reliable but not guaranteed.
Copyright © 2025 State-Wide MLS, Inc. All rights reserved.