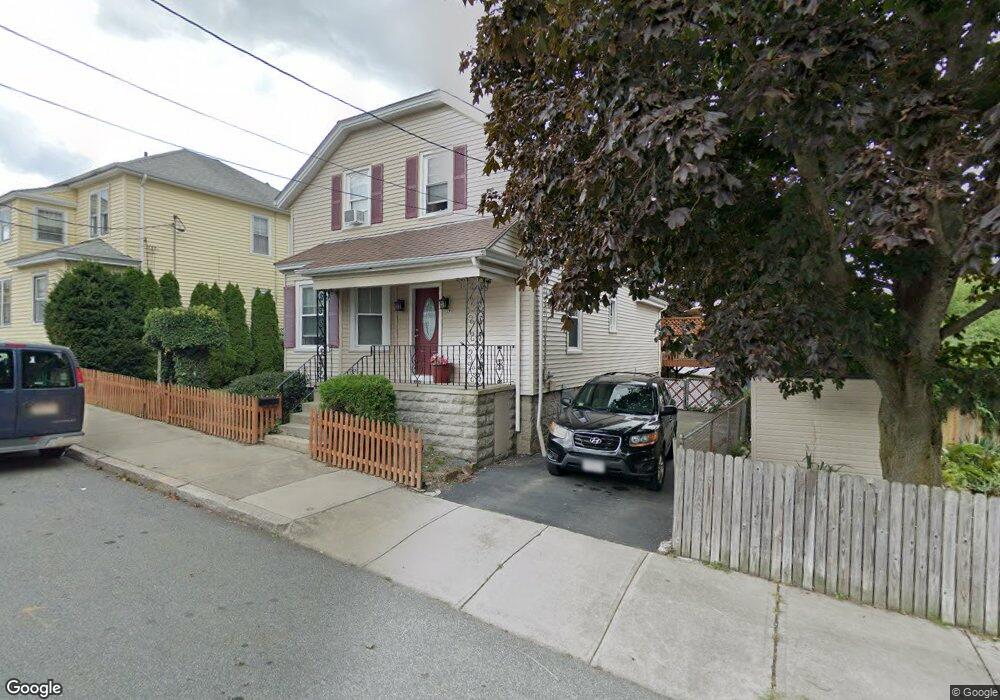
37 Queen St Fall River, MA 02724
Sandy Beach NeighborhoodEstimated Value: $374,000 - $434,000
3
Beds
2
Baths
1,423
Sq Ft
$282/Sq Ft
Est. Value
About This Home
This home is located at 37 Queen St, Fall River, MA 02724 and is currently estimated at $401,107, approximately $281 per square foot. 37 Queen St is a home located in Bristol County with nearby schools including Carlton M. Viveiros Elementary School, Matthew J. Kuss Middle School, and B M C Durfee High School.
Ownership History
Date
Name
Owned For
Owner Type
Purchase Details
Closed on
Aug 22, 2008
Sold by
Silvia Christine A and Silvia Joseph T
Bought by
Silvia Christine A
Current Estimated Value
Purchase Details
Closed on
Aug 23, 1999
Sold by
Soares James R
Bought by
Silvia Joseph T and Silvia Christine A
Home Financials for this Owner
Home Financials are based on the most recent Mortgage that was taken out on this home.
Original Mortgage
$126,378
Interest Rate
7.6%
Mortgage Type
Purchase Money Mortgage
Create a Home Valuation Report for This Property
The Home Valuation Report is an in-depth analysis detailing your home's value as well as a comparison with similar homes in the area
Home Values in the Area
Average Home Value in this Area
Purchase History
| Date | Buyer | Sale Price | Title Company |
|---|---|---|---|
| Silvia Christine A | -- | -- | |
| Silvia Joseph T | $123,900 | -- |
Source: Public Records
Mortgage History
| Date | Status | Borrower | Loan Amount |
|---|---|---|---|
| Previous Owner | Silvia Joseph T | $158,000 | |
| Previous Owner | Silvia Joseph T | $144,000 | |
| Previous Owner | Silvia Joseph T | $126,378 |
Source: Public Records
Tax History
| Year | Tax Paid | Tax Assessment Tax Assessment Total Assessment is a certain percentage of the fair market value that is determined by local assessors to be the total taxable value of land and additions on the property. | Land | Improvement |
|---|---|---|---|---|
| 2025 | $3,430 | $299,600 | $108,500 | $191,100 |
| 2024 | $3,231 | $281,200 | $104,500 | $176,700 |
| 2023 | $2,979 | $242,800 | $86,400 | $156,400 |
| 2022 | $2,795 | $221,500 | $82,200 | $139,300 |
| 2021 | $2,640 | $190,900 | $78,200 | $112,700 |
| 2020 | $2,673 | $185,000 | $77,100 | $107,900 |
| 2019 | $2,575 | $176,600 | $74,200 | $102,400 |
| 2018 | $2,481 | $169,700 | $80,400 | $89,300 |
| 2017 | $2,313 | $165,200 | $76,600 | $88,600 |
| 2016 | $2,261 | $165,900 | $81,600 | $84,300 |
| 2015 | $2,230 | $170,500 | $81,600 | $88,900 |
| 2014 | $2,115 | $168,100 | $79,200 | $88,900 |
Source: Public Records
Map
Nearby Homes
- 20 Wilcox St
- 245 Dwelly St
- 464 Birch St
- 609 King Philip St
- 1334 S Main St
- 1273-1279 S Main St
- 70 Brown St
- 1846 S Main St
- 1852 S Main St
- 234 Kilburn St
- 917 Dwelly St
- 57 Larouche St
- 15 Higgins St
- 344-354 E Main St
- 71 Mystic St Unit 3
- 219 Montaup St
- 700 Shore Dr Unit 6-604
- 700 Shore Dr Unit 1205
- 700 Shore Dr Unit 810
- 82 Montaup St
Your Personal Tour Guide
Ask me questions while you tour the home.