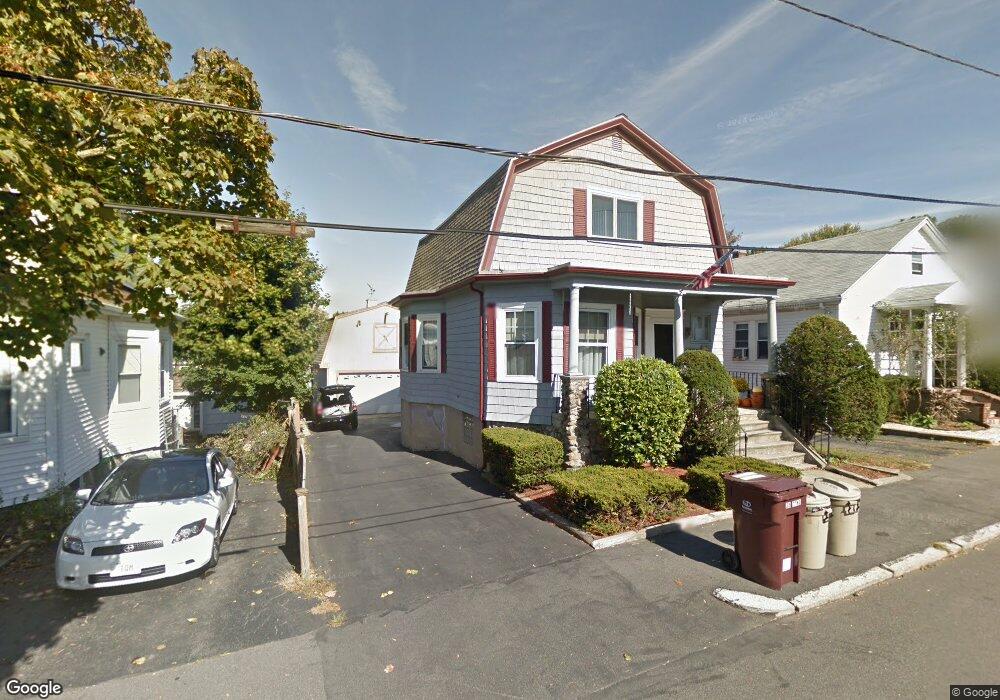
37 Rand St Revere, MA 02151
West Revere NeighborhoodEstimated Value: $589,000 - $662,408
3
Beds
2
Baths
1,680
Sq Ft
$373/Sq Ft
Est. Value
About This Home
This home is located at 37 Rand St, Revere, MA 02151 and is currently estimated at $626,102, approximately $372 per square foot. 37 Rand St is a home located in Suffolk County with nearby schools including Staff Sargent James J. Hill Elementary School, A.C. Whelan Elementary School, and Susan B. Anthony Middle School.
Ownership History
Date
Name
Owned For
Owner Type
Purchase Details
Closed on
Dec 15, 2015
Sold by
35 Rand Street Nt and Caramanica
Bought by
Kwmuntis Lisa and Gianchinta Jane
Current Estimated Value
Purchase Details
Closed on
Aug 11, 1994
Sold by
Boston City Of
Bought by
Pizzano Saverio
Create a Home Valuation Report for This Property
The Home Valuation Report is an in-depth analysis detailing your home's value as well as a comparison with similar homes in the area
Home Values in the Area
Average Home Value in this Area
Purchase History
| Date | Buyer | Sale Price | Title Company |
|---|---|---|---|
| Kwmuntis Lisa | -- | -- | |
| Kwmuntis Lisa | -- | -- | |
| Kwmuntis Lisa | -- | -- | |
| Pizzano Saverio | $7,241 | -- | |
| Pizzano Saverio | $7,241 | -- |
Source: Public Records
Mortgage History
| Date | Status | Borrower | Loan Amount |
|---|---|---|---|
| Previous Owner | Pizzano Saverio | $80,000 | |
| Previous Owner | Pizzano Saverio | $35,000 | |
| Previous Owner | Pizzano Saverio | $50,000 |
Source: Public Records
Tax History Compared to Growth
Tax History
| Year | Tax Paid | Tax Assessment Tax Assessment Total Assessment is a certain percentage of the fair market value that is determined by local assessors to be the total taxable value of land and additions on the property. | Land | Improvement |
|---|---|---|---|---|
| 2025 | $5,232 | $576,800 | $285,200 | $291,600 |
| 2024 | $5,071 | $556,600 | $269,400 | $287,200 |
| 2023 | $4,804 | $505,100 | $225,000 | $280,100 |
| 2022 | $4,774 | $459,000 | $213,900 | $245,100 |
| 2021 | $4,589 | $414,900 | $198,100 | $216,800 |
| 2020 | $4,672 | $414,900 | $198,100 | $216,800 |
| 2019 | $4,551 | $375,800 | $180,600 | $195,200 |
| 2018 | $4,404 | $339,800 | $163,200 | $176,600 |
| 2017 | $4,264 | $304,800 | $142,600 | $162,200 |
| 2016 | $3,910 | $270,600 | $129,900 | $140,700 |
| 2015 | $4,005 | $270,600 | $129,900 | $140,700 |
Source: Public Records
Map
Nearby Homes