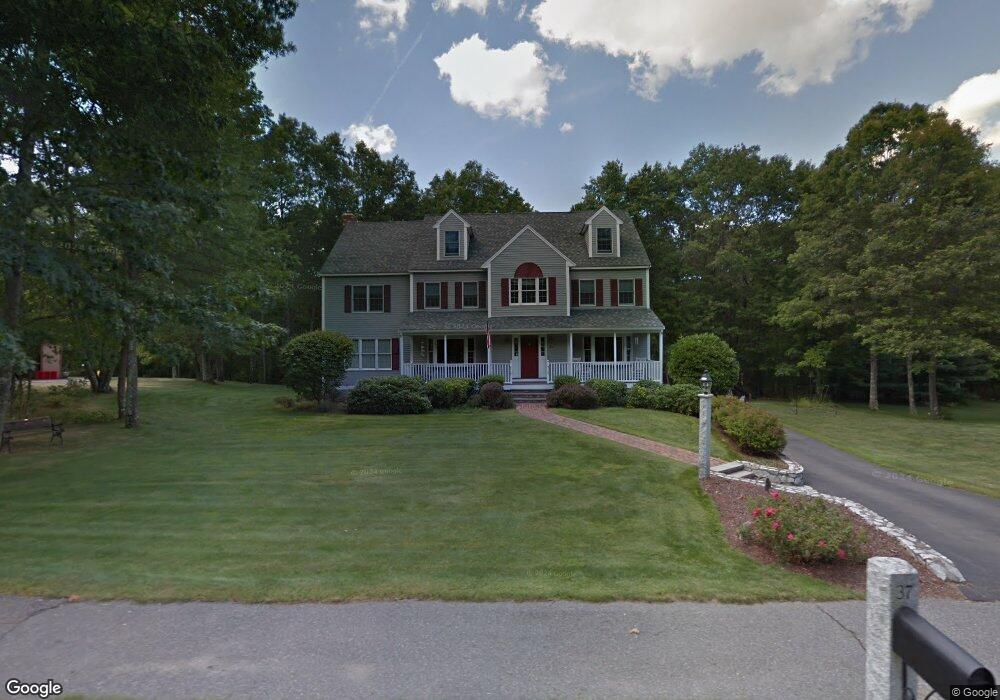
37 Roma Ln Reading, MA 01867
Estimated Value: $1,455,092 - $1,905,000
5
Beds
3
Baths
3,328
Sq Ft
$487/Sq Ft
Est. Value
About This Home
This home is located at 37 Roma Ln, Reading, MA 01867 and is currently estimated at $1,620,273, approximately $486 per square foot. 37 Roma Ln is a home located in Middlesex County with nearby schools including Wood End Elementary School, Arthur W. Coolidge Middle School, and Reading Memorial High School.
Ownership History
Date
Name
Owned For
Owner Type
Purchase Details
Closed on
May 29, 2024
Sold by
Connolly Carolann
Bought by
Connolly Mark M
Current Estimated Value
Purchase Details
Closed on
Jun 21, 2001
Sold by
Brenton Michael J and Brenton Marjorie Ann
Bought by
Connolly Mark M and Connolly Carolann
Home Financials for this Owner
Home Financials are based on the most recent Mortgage that was taken out on this home.
Original Mortgage
$500,000
Interest Rate
7.09%
Mortgage Type
Purchase Money Mortgage
Purchase Details
Closed on
May 26, 1995
Sold by
Simpson Ralph
Bought by
Brenton Michael J and Brenton Marjorie A
Purchase Details
Closed on
Aug 12, 1994
Sold by
Alsarabi Shawqi
Bought by
Simpson Ralph
Create a Home Valuation Report for This Property
The Home Valuation Report is an in-depth analysis detailing your home's value as well as a comparison with similar homes in the area
Home Values in the Area
Average Home Value in this Area
Purchase History
| Date | Buyer | Sale Price | Title Company |
|---|---|---|---|
| Connolly Mark M | -- | None Available | |
| Connolly Mark M | -- | None Available | |
| Simpson Ralph | $170,000 | -- | |
| Connolly Mark M | $775,000 | -- | |
| Brenton Michael J | $494,350 | -- |
Source: Public Records
Mortgage History
| Date | Status | Borrower | Loan Amount |
|---|---|---|---|
| Previous Owner | Brenton Michael J | $320,000 | |
| Previous Owner | Brenton Michael J | $345,000 | |
| Previous Owner | Brenton Michael J | $500,000 |
Source: Public Records
Tax History Compared to Growth
Tax History
| Year | Tax Paid | Tax Assessment Tax Assessment Total Assessment is a certain percentage of the fair market value that is determined by local assessors to be the total taxable value of land and additions on the property. | Land | Improvement |
|---|---|---|---|---|
| 2025 | $15,492 | $1,360,100 | $558,700 | $801,400 |
| 2024 | $15,558 | $1,327,500 | $545,300 | $782,200 |
| 2023 | $14,521 | $1,153,400 | $473,800 | $679,600 |
| 2022 | $14,504 | $1,088,100 | $447,000 | $641,100 |
| 2021 | $4,616 | $981,200 | $434,100 | $547,100 |
| 2020 | $13,572 | $954,700 | $422,400 | $532,300 |
| 2019 | $13,082 | $919,300 | $406,700 | $512,600 |
| 2018 | $3,879 | $910,500 | $402,800 | $507,700 |
| 2017 | $12,403 | $884,000 | $391,100 | $492,900 |
| 2016 | $12,946 | $892,800 | $358,500 | $534,300 |
| 2015 | $11,931 | $811,600 | $325,900 | $485,700 |
| 2014 | $11,963 | $811,600 | $325,900 | $485,700 |
Source: Public Records
Map
Nearby Homes