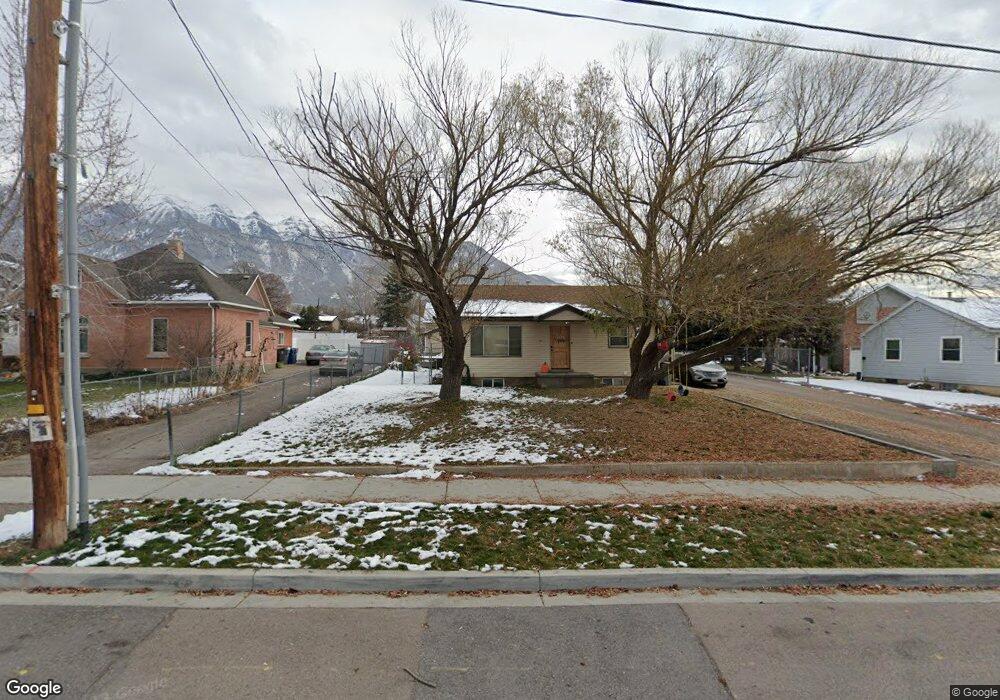
37 S 400 E Pleasant Grove, UT 84062
Estimated Value: $517,000 - $563,911
4
Beds
2
Baths
1,757
Sq Ft
$308/Sq Ft
Est. Value
About This Home
This home is located at 37 S 400 E, Pleasant Grove, UT 84062 and is currently estimated at $541,228, approximately $308 per square foot. 37 S 400 E is a home with nearby schools including Central Elementary School, Pleasant Grove Junior High School, and Pleasant Grove High School.
Ownership History
Date
Name
Owned For
Owner Type
Purchase Details
Closed on
Feb 4, 2013
Sold by
Habitat For Humanity Of Utah County Inc
Bought by
Brandon Nathan J and Brandon Kendall L
Current Estimated Value
Home Financials for this Owner
Home Financials are based on the most recent Mortgage that was taken out on this home.
Original Mortgage
$195,000
Outstanding Balance
$135,747
Interest Rate
3.32%
Mortgage Type
Purchase Money Mortgage
Estimated Equity
$405,481
Purchase Details
Closed on
Feb 24, 2012
Sold by
Brandon Ronald O and Brandon Susan R
Bought by
Habitat For Humanity Of Utah County Inc
Home Financials for this Owner
Home Financials are based on the most recent Mortgage that was taken out on this home.
Original Mortgage
$51,000
Interest Rate
3.92%
Mortgage Type
Credit Line Revolving
Create a Home Valuation Report for This Property
The Home Valuation Report is an in-depth analysis detailing your home's value as well as a comparison with similar homes in the area
Home Values in the Area
Average Home Value in this Area
Purchase History
| Date | Buyer | Sale Price | Title Company |
|---|---|---|---|
| Brandon Nathan J | -- | Title West | |
| Habitat For Humanity Of Utah County Inc | -- | None Available |
Source: Public Records
Mortgage History
| Date | Status | Borrower | Loan Amount |
|---|---|---|---|
| Open | Brandon Nathan J | $195,000 | |
| Previous Owner | Habitat For Humanity Of Utah County Inc | $51,000 |
Source: Public Records
Tax History Compared to Growth
Tax History
| Year | Tax Paid | Tax Assessment Tax Assessment Total Assessment is a certain percentage of the fair market value that is determined by local assessors to be the total taxable value of land and additions on the property. | Land | Improvement |
|---|---|---|---|---|
| 2025 | $2,123 | $265,815 | $209,900 | $273,400 |
| 2024 | $2,123 | $253,440 | $0 | $0 |
| 2023 | $2,115 | $258,390 | $0 | $0 |
| 2022 | $2,148 | $261,085 | $0 | $0 |
| 2021 | $1,854 | $343,200 | $150,600 | $192,600 |
| 2020 | $1,706 | $309,600 | $134,500 | $175,100 |
| 2019 | $1,575 | $295,600 | $123,600 | $172,000 |
| 2018 | $1,496 | $265,500 | $112,700 | $152,800 |
| 2017 | $1,440 | $136,015 | $0 | $0 |
| 2016 | $1,434 | $130,735 | $0 | $0 |
| 2015 | $1,514 | $130,735 | $0 | $0 |
| 2014 | $1,476 | $126,280 | $0 | $0 |
Source: Public Records
Map
Nearby Homes
- 450 E Center St
- 420 E Center St Unit 430
- 460 E Center St
- 31 S 400 E
- 15 S 400 E
- 472 E Center St
- 45 S 400 E
- 470 E Center St
- 5 S 400 E
- 52 S 400 E
- 65 S 400 E
- 475 E 100 S
- 447 E 100 S
- 451 E 100 S
- 435 E Center St
- 435 E Center St Unit Center St. Basement
- 433 E 100 S
- 415 E Center St
- 453 E Center St
- 480 E Center St