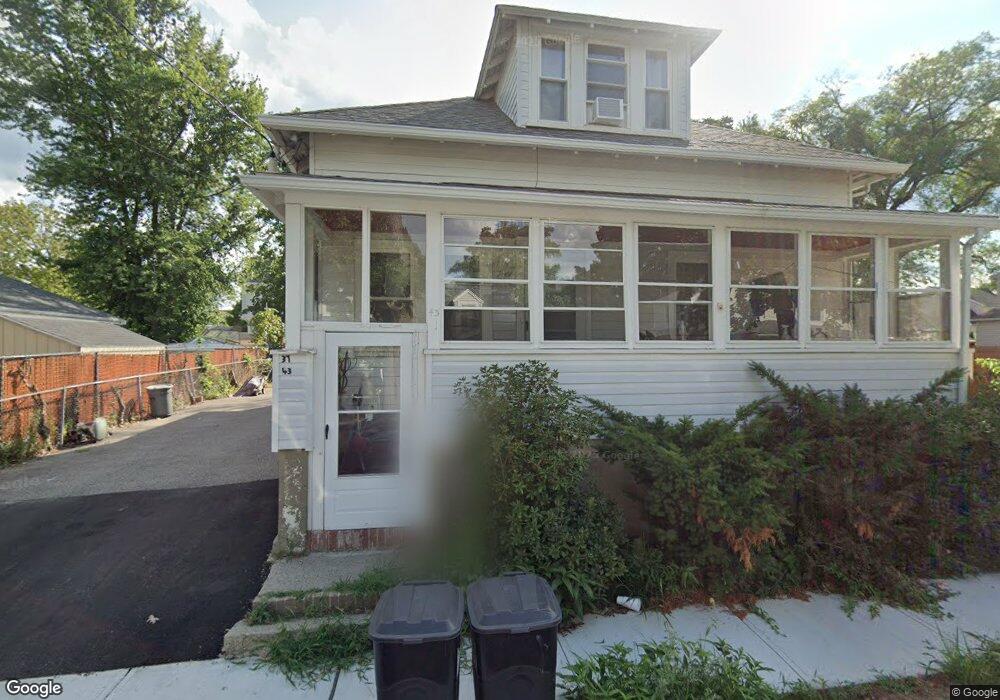
37 Sagamore Ave Quincy, MA 02171
Montclair NeighborhoodEstimated Value: $730,000 - $779,000
3
Beds
2
Baths
1,680
Sq Ft
$448/Sq Ft
Est. Value
About This Home
This home is located at 37 Sagamore Ave, Quincy, MA 02171 and is currently estimated at $752,858, approximately $448 per square foot. 37 Sagamore Ave is a home located in Norfolk County with nearby schools including Montclair Elementary School, Atlantic Middle School, and North Quincy High School.
Ownership History
Date
Name
Owned For
Owner Type
Purchase Details
Closed on
Oct 5, 2004
Sold by
Melody Patricia L and Melody Robert J
Bought by
Khiyaty Abderrahim and Khoudaijy Fatiha
Current Estimated Value
Home Financials for this Owner
Home Financials are based on the most recent Mortgage that was taken out on this home.
Original Mortgage
$272,400
Outstanding Balance
$135,268
Interest Rate
5.81%
Mortgage Type
Purchase Money Mortgage
Estimated Equity
$617,590
Create a Home Valuation Report for This Property
The Home Valuation Report is an in-depth analysis detailing your home's value as well as a comparison with similar homes in the area
Home Values in the Area
Average Home Value in this Area
Purchase History
| Date | Buyer | Sale Price | Title Company |
|---|---|---|---|
| Khiyaty Abderrahim | $340,500 | -- |
Source: Public Records
Mortgage History
| Date | Status | Borrower | Loan Amount |
|---|---|---|---|
| Open | Khiyaty Abderrahim | $272,400 | |
| Previous Owner | Khiyaty Abderrahim | $115,000 |
Source: Public Records
Tax History Compared to Growth
Tax History
| Year | Tax Paid | Tax Assessment Tax Assessment Total Assessment is a certain percentage of the fair market value that is determined by local assessors to be the total taxable value of land and additions on the property. | Land | Improvement |
|---|---|---|---|---|
| 2025 | $7,838 | $679,800 | $396,100 | $283,700 |
| 2024 | $7,553 | $670,200 | $396,100 | $274,100 |
| 2023 | $7,281 | $654,200 | $377,400 | $276,800 |
| 2022 | $7,213 | $602,100 | $328,500 | $273,600 |
| 2021 | $7,021 | $578,300 | $313,000 | $265,300 |
| 2020 | $6,961 | $560,000 | $313,000 | $247,000 |
| 2019 | $6,556 | $522,400 | $292,700 | $229,700 |
| 2018 | $6,461 | $484,300 | $271,200 | $213,100 |
| 2017 | $6,321 | $446,100 | $258,400 | $187,700 |
| 2016 | $5,758 | $401,000 | $225,100 | $175,900 |
| 2015 | $5,293 | $362,500 | $204,900 | $157,600 |
| 2014 | $5,057 | $340,300 | $195,300 | $145,000 |
Source: Public Records
Map
Nearby Homes
- 115 W Squantum St Unit 810
- 115 W Squantum St Unit 907
- 39 Fayette St Unit 102
- 444 W Squantum St
- 150 Hancock St Unit 102
- 182 Granite Ave
- 204 Farrington St
- 143 Arlington St
- 57 Quincy Shore Dr Unit 614
- 57 Quincy Shore Dr Unit PH South
- 94 Newbury Ave Unit 100
- 133 Commander Shea Blvd Unit 219
- 133 Commander Shea Blvd Unit 506
- 133 Commander Shea Blvd Unit 215
- 133 Commander Shea Blvd Unit 315
- 1 Edwin St Unit C
- 15 California Ave
- 511 Hancock St Unit 207
- 21 Linden St Unit 417
- 260 Elmwood Ave
- 43 Sagamore Ave
- 19 Sterling St
- 21 Sterling St Unit 21
- 35 Sagamore Ave
- 35 Sagamore Ave Unit 1
- 35 Sagamore Ave Unit 2
- 44 Sagamore Ave
- 40 Sagamore Ave
- 48 Sagamore Ave
- 46 Ardell St
- 42 Ardell St
- 48 Ardell St Unit 2
- 52 Ardell St
- 31 Sagamore Ave
- 9 Sterling St
- 40 Ardell St
- 32 Sagamore Ave
- 5 Sterling St
- 36 Ardell St
- 37 Montclair Ave