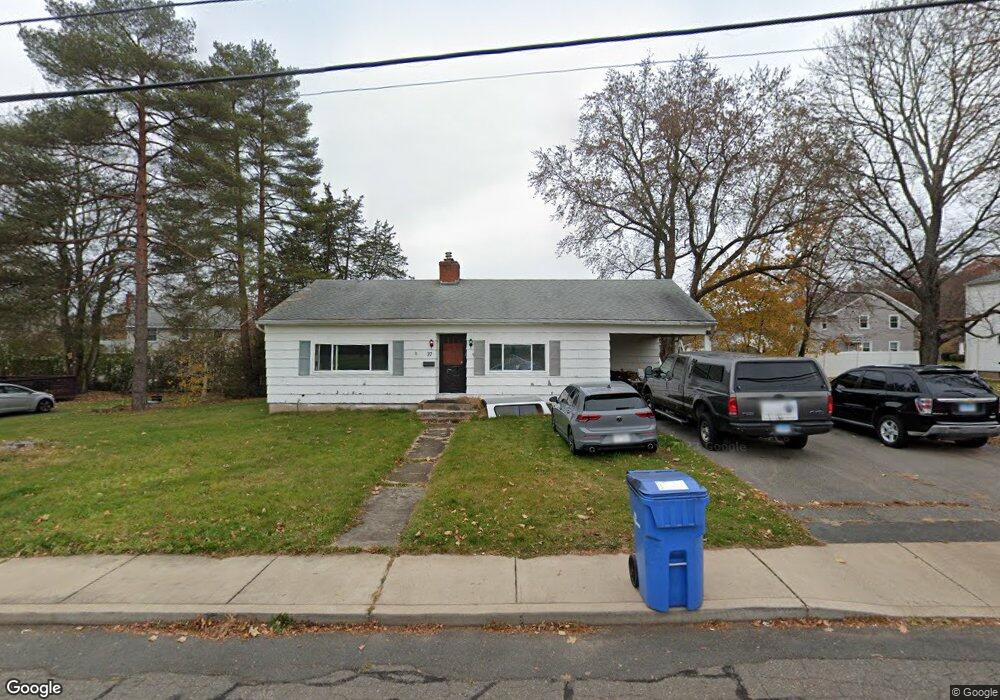
37 Saint Paul Dr Manchester, CT 06042
Buckley District NeighborhoodEstimated Value: $260,000 - $301,907
3
Beds
1
Bath
1,154
Sq Ft
$247/Sq Ft
Est. Value
About This Home
This home is located at 37 Saint Paul Dr, Manchester, CT 06042 and is currently estimated at $284,977, approximately $246 per square foot. 37 Saint Paul Dr is a home located in Hartford County with nearby schools including Buckley School, Illing Middle School, and Elisabeth M. Bennet Academy.
Ownership History
Date
Name
Owned For
Owner Type
Purchase Details
Closed on
Nov 9, 2007
Sold by
Ringstone Allen C and Foss Holly A
Bought by
Ferry Keith J
Current Estimated Value
Home Financials for this Owner
Home Financials are based on the most recent Mortgage that was taken out on this home.
Original Mortgage
$135,800
Outstanding Balance
$86,320
Interest Rate
6.47%
Estimated Equity
$198,657
Create a Home Valuation Report for This Property
The Home Valuation Report is an in-depth analysis detailing your home's value as well as a comparison with similar homes in the area
Home Values in the Area
Average Home Value in this Area
Purchase History
| Date | Buyer | Sale Price | Title Company |
|---|---|---|---|
| Ferry Keith J | $140,000 | -- | |
| Ferry Keith J | $140,000 | -- |
Source: Public Records
Mortgage History
| Date | Status | Borrower | Loan Amount |
|---|---|---|---|
| Open | Ferry Keith J | $135,800 | |
| Closed | Ferry Keith J | $135,800 | |
| Previous Owner | Ferry Keith J | $30,456 | |
| Previous Owner | Ferry Keith J | $20,946 |
Source: Public Records
Tax History Compared to Growth
Tax History
| Year | Tax Paid | Tax Assessment Tax Assessment Total Assessment is a certain percentage of the fair market value that is determined by local assessors to be the total taxable value of land and additions on the property. | Land | Improvement |
|---|---|---|---|---|
| 2025 | $5,009 | $125,800 | $38,600 | $87,200 |
| 2024 | $4,866 | $125,800 | $38,600 | $87,200 |
| 2023 | $4,680 | $125,800 | $38,600 | $87,200 |
| 2022 | $4,544 | $125,800 | $38,600 | $87,200 |
| 2021 | $4,164 | $99,300 | $33,000 | $66,300 |
| 2020 | $4,158 | $99,300 | $33,000 | $66,300 |
| 2019 | $4,141 | $99,300 | $33,000 | $66,300 |
| 2018 | $4,062 | $99,300 | $33,000 | $66,300 |
| 2017 | $3,947 | $99,300 | $33,000 | $66,300 |
| 2016 | $4,234 | $106,700 | $42,000 | $64,700 |
| 2015 | $4,204 | $106,700 | $42,000 | $64,700 |
| 2014 | $4,124 | $106,700 | $42,000 | $64,700 |
Source: Public Records
Map
Nearby Homes