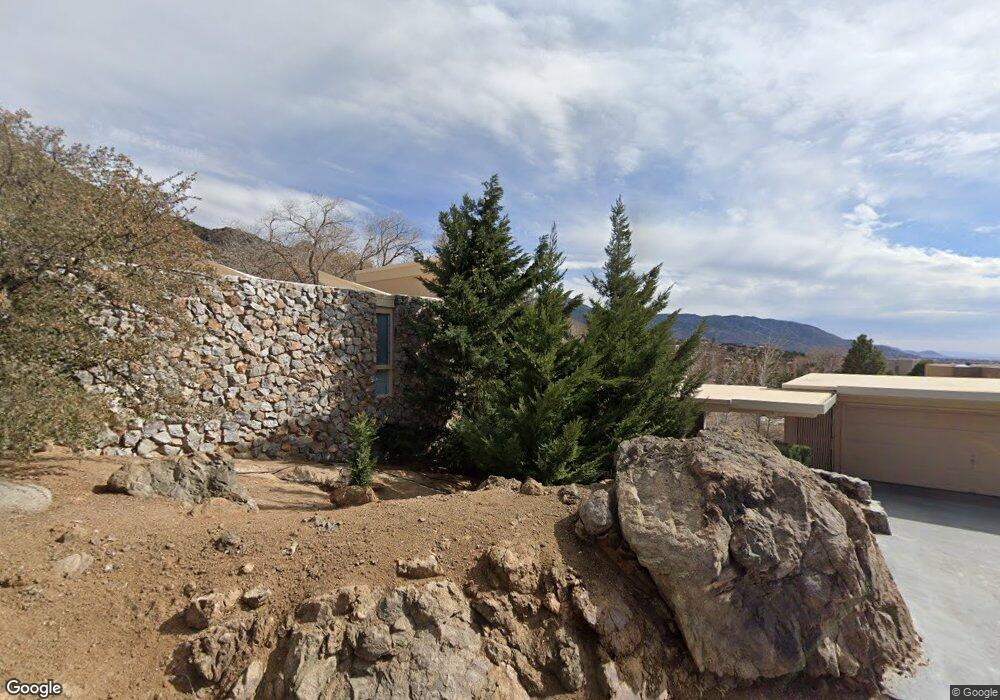
37 Sandia Heights Dr NE Unit 1 Albuquerque, NM 87122
Estimated Value: $730,236 - $872,000
3
Beds
3
Baths
2,677
Sq Ft
$288/Sq Ft
Est. Value
About This Home
This home is located at 37 Sandia Heights Dr NE Unit 1, Albuquerque, NM 87122 and is currently estimated at $771,559, approximately $288 per square foot. 37 Sandia Heights Dr NE Unit 1 is a home located in Bernalillo County with nearby schools including Double Eagle Elementary School, Desert Ridge Middle School, and La Cueva High School.
Ownership History
Date
Name
Owned For
Owner Type
Purchase Details
Closed on
Nov 15, 2019
Sold by
Hedger Joe J and Hedger Maria Patsy C
Bought by
Hedger Joe J and Hedger Maria Patsy C
Current Estimated Value
Purchase Details
Closed on
Aug 3, 2007
Sold by
Agarwal Mikhil V
Bought by
Hedger Joe and Hedger Maria Patsy B
Purchase Details
Closed on
Jan 4, 2007
Sold by
Ross Karen
Bought by
Agarwal Mikhil
Home Financials for this Owner
Home Financials are based on the most recent Mortgage that was taken out on this home.
Original Mortgage
$416,800
Interest Rate
6.2%
Mortgage Type
Purchase Money Mortgage
Purchase Details
Closed on
Aug 22, 2001
Sold by
Howard Albert L and Howard Artis A
Bought by
Ross Karen
Home Financials for this Owner
Home Financials are based on the most recent Mortgage that was taken out on this home.
Original Mortgage
$262,500
Interest Rate
6.88%
Create a Home Valuation Report for This Property
The Home Valuation Report is an in-depth analysis detailing your home's value as well as a comparison with similar homes in the area
Home Values in the Area
Average Home Value in this Area
Purchase History
| Date | Buyer | Sale Price | Title Company |
|---|---|---|---|
| Hedger Joe J | -- | None Available | |
| Hedger Joe | -- | Fidelity National Title Co | |
| Agarwal Mikhil | -- | Stewart Title | |
| Ross Karen | -- | First American |
Source: Public Records
Mortgage History
| Date | Status | Borrower | Loan Amount |
|---|---|---|---|
| Previous Owner | Agarwal Mikhil | $416,800 | |
| Previous Owner | Ross Karen | $262,500 |
Source: Public Records
Tax History Compared to Growth
Tax History
| Year | Tax Paid | Tax Assessment Tax Assessment Total Assessment is a certain percentage of the fair market value that is determined by local assessors to be the total taxable value of land and additions on the property. | Land | Improvement |
|---|---|---|---|---|
| 2025 | $4,197 | $145,204 | $39,844 | $105,360 |
| 2024 | $4,197 | $140,974 | $38,683 | $102,291 |
| 2023 | $4,130 | $136,869 | $37,557 | $99,312 |
| 2022 | $3,989 | $132,883 | $36,463 | $96,420 |
| 2021 | $3,853 | $129,013 | $35,401 | $93,612 |
| 2020 | $3,790 | $125,255 | $34,370 | $90,885 |
| 2019 | $3,677 | $121,607 | $33,369 | $88,238 |
| 2018 | $3,543 | $121,607 | $33,369 | $88,238 |
| 2017 | $3,431 | $118,065 | $32,397 | $85,668 |
| 2016 | $3,320 | $111,289 | $30,538 | $80,751 |
| 2015 | $108,048 | $108,048 | $29,649 | $78,399 |
| 2014 | $3,162 | $104,901 | $28,785 | $76,116 |
| 2013 | -- | $101,846 | $27,947 | $73,899 |
Source: Public Records
Map
Nearby Homes
- 51 Rock Ridge Dr NE
- 48 Rock Ridge Dr NE
- 47 Rock Dr NE
- 9 Sandia Heights Dr NE
- 58 Rock Point Place NE
- 252 Spring Creek Place NE
- 213 Spring Creek Place NE
- 77 Pinon Hill Place NE
- 720 Tramway Ln NE Unit 24
- 12519 Elena Dr NE
- 10 La Luz Trail NE
- 12511 Elena Dr NE
- 22 Tierra Monte Dr
- 15 La Cueva Trail NE
- 24 Tierra Monte Ct
- 2820 Tramway Cir NE
- 8820 Gypsy Dr NE
- 711 Tramway Place NE Unit 30
- 793 Tramway Ln NE Unit M
- 450 Live Oak Ln NE
- 37 Sandia Heights Dr NE
- 14 Sandia Heights Dr NE
- 38 Sandia Heights Dr NE
- 13 Sandia Heights Dr NE
- 36 Sandia Heights Dr NE
- 40 Sandia Heights Dr NE
- 23 Sandia Heights Dr NE
- 24 Sandia Heights Dr NE
- 15 Sandia Heights Dr NE
- 39 Sandia Heights Dr NE
- 12 Sandia Heights Dr NE
- 35 Sandia Heights Dr NE
- 53 Rock Ridge Ct NE
- 21 Sandia Heights Dr NE
- 51 Sandia Heights Dr NE
- 22 Sandia Heights Dr NE
- 16 Sandia Heights Dr NE
- 25 Sandia Heights Dr NE
- 25 Sandia Heights Dr NE Unit 1
- 20 Sandia Heights Dr NE