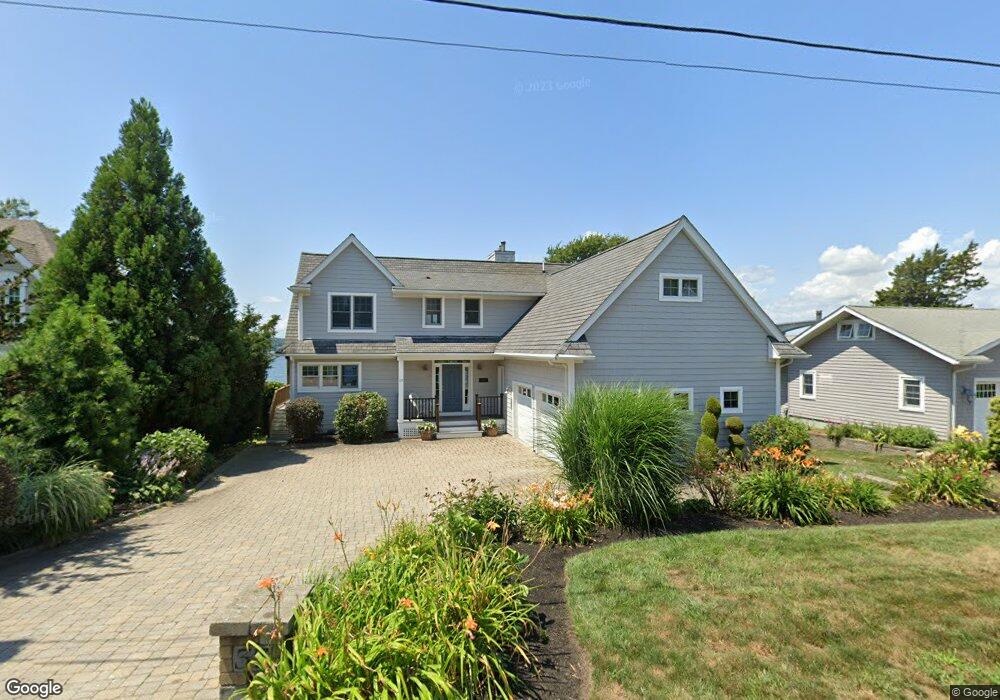
37 Seaside Dr Jamestown, RI 02835
Jamestown Shores NeighborhoodEstimated Value: $2,293,000 - $2,858,000
4
Beds
4
Baths
4,226
Sq Ft
$594/Sq Ft
Est. Value
About This Home
This home is located at 37 Seaside Dr, Jamestown, RI 02835 and is currently estimated at $2,509,203, approximately $593 per square foot. 37 Seaside Dr is a home located in Newport County with nearby schools including Melrose Avenue School and Lawn Avenue School.
Ownership History
Date
Name
Owned For
Owner Type
Purchase Details
Closed on
Nov 13, 2025
Sold by
Gray Karen E
Bought by
Kaen E Gray Ret and Gray
Current Estimated Value
Purchase Details
Closed on
Dec 15, 2010
Sold by
Perrett William W and Perrett Jacqueline G
Bought by
Gray John B and Gray Karen E
Purchase Details
Closed on
May 28, 2004
Sold by
Felner Robert and Felner Marilyn
Bought by
Perreit William and Perreit Jacqueline
Purchase Details
Closed on
Jul 20, 2001
Sold by
Rosenzweig Andrew R and Rosenzweig Mary
Bought by
Felner Robert D and Felner Marilyn
Purchase Details
Closed on
Feb 13, 1997
Sold by
Sorensen Eric W and Sorensen Madeline
Bought by
Rosenzweig Andrew R and Rosenzweig Mary
Create a Home Valuation Report for This Property
The Home Valuation Report is an in-depth analysis detailing your home's value as well as a comparison with similar homes in the area
Home Values in the Area
Average Home Value in this Area
Purchase History
| Date | Buyer | Sale Price | Title Company |
|---|---|---|---|
| Kaen E Gray Ret | -- | -- | |
| Gray John B | $1,800,000 | -- | |
| Perreit William | $1,663,500 | -- | |
| Felner Robert D | $560,000 | -- | |
| Rosenzweig Andrew R | $245,000 | -- |
Source: Public Records
Mortgage History
| Date | Status | Borrower | Loan Amount |
|---|---|---|---|
| Previous Owner | Rosenzweig Andrew R | $300,000 | |
| Previous Owner | Rosenzweig Andrew R | $250,000 |
Source: Public Records
Tax History
| Year | Tax Paid | Tax Assessment Tax Assessment Total Assessment is a certain percentage of the fair market value that is determined by local assessors to be the total taxable value of land and additions on the property. | Land | Improvement |
|---|---|---|---|---|
| 2025 | $11,739 | $2,081,400 | $971,000 | $1,110,400 |
| 2024 | $10,635 | $1,483,200 | $735,200 | $748,000 |
| 2023 | $10,485 | $1,502,100 | $735,200 | $766,900 |
| 2022 | $10,199 | $1,502,100 | $735,200 | $766,900 |
| 2021 | $11,340 | $1,369,600 | $638,800 | $730,800 |
| 2020 | $11,053 | $1,369,600 | $638,800 | $730,800 |
| 2019 | $11,025 | $1,369,600 | $638,800 | $730,800 |
| 2018 | $10,232 | $1,156,200 | $563,800 | $592,400 |
| 2017 | $10,013 | $1,156,200 | $563,800 | $592,400 |
| 2016 | $9,920 | $1,156,200 | $563,800 | $592,400 |
| 2015 | $9,993 | $1,138,100 | $659,300 | $478,800 |
| 2014 | $9,958 | $1,138,100 | $659,300 | $478,800 |
Source: Public Records
Map
Nearby Homes
- 121 Seaside Dr
- 174 Seaside Dr
- 10 Coulter St
- 48 Ocean Ave
- 30 W Bay View Dr
- 63 Pemberton Ave
- 127 Longfellow Rd
- 46 North Rd
- 63 Longfellow Rd
- 31 Buloid Ave
- 78 Narragansett Ave
- 24 Southwest Ave
- 22 Southwest Ave
- 73 Conanicus Ave Unit 4
- 14 Clinton Ave
- 22 Cole St
- 104 Howland Ave
- 30 Walcott Ave
- 777 E Shore Rd
- 9 Parsley Ln
Your Personal Tour Guide
Ask me questions while you tour the home.