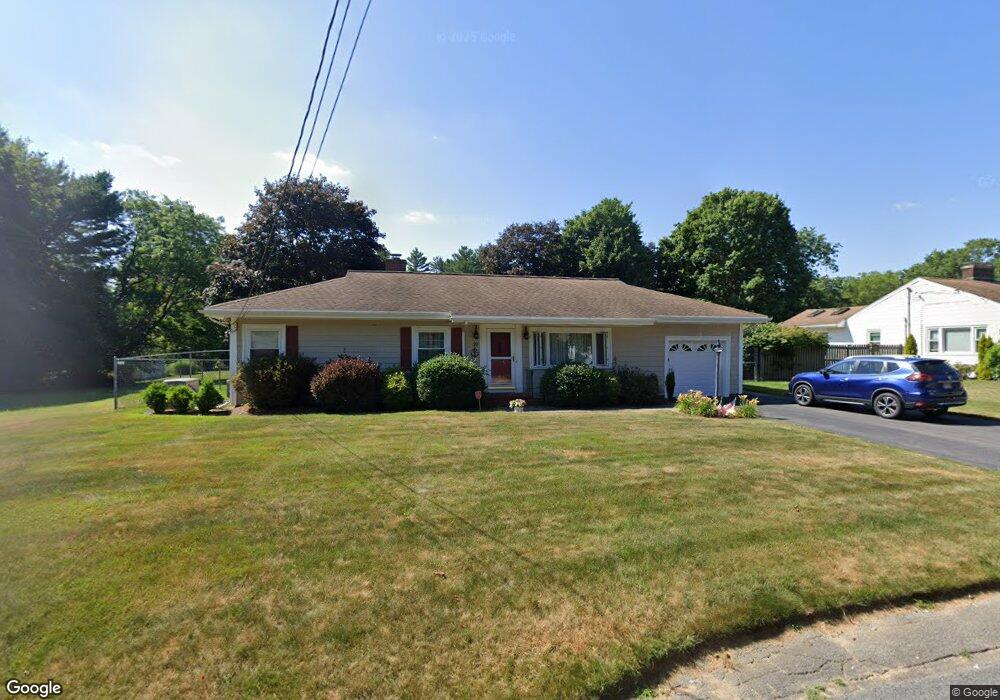
37 Shawnee Ave East Bridgewater, MA 02333
Estimated Value: $516,174 - $548,000
3
Beds
2
Baths
1,352
Sq Ft
$393/Sq Ft
Est. Value
About This Home
This home is located at 37 Shawnee Ave, East Bridgewater, MA 02333 and is currently estimated at $531,044, approximately $392 per square foot. 37 Shawnee Ave is a home located in Plymouth County with nearby schools including Gordon W Mitchell Middle School, East Bridgewater Jr./Sr. High School, and New Heights Charter School.
Ownership History
Date
Name
Owned For
Owner Type
Purchase Details
Closed on
Feb 26, 2008
Sold by
Day Harvey and Day Marie U
Bought by
Day Ft
Current Estimated Value
Purchase Details
Closed on
Nov 15, 1999
Sold by
Goodnow Marion A Est
Bought by
Day Harvey and Day Marie U
Home Financials for this Owner
Home Financials are based on the most recent Mortgage that was taken out on this home.
Original Mortgage
$170,905
Interest Rate
7.68%
Mortgage Type
Purchase Money Mortgage
Create a Home Valuation Report for This Property
The Home Valuation Report is an in-depth analysis detailing your home's value as well as a comparison with similar homes in the area
Home Values in the Area
Average Home Value in this Area
Purchase History
| Date | Buyer | Sale Price | Title Company |
|---|---|---|---|
| Day Ft | -- | -- | |
| Day Harvey | $179,900 | -- |
Source: Public Records
Mortgage History
| Date | Status | Borrower | Loan Amount |
|---|---|---|---|
| Previous Owner | Day Harvey | $30,000 | |
| Previous Owner | Day Harvey | $170,905 |
Source: Public Records
Tax History Compared to Growth
Tax History
| Year | Tax Paid | Tax Assessment Tax Assessment Total Assessment is a certain percentage of the fair market value that is determined by local assessors to be the total taxable value of land and additions on the property. | Land | Improvement |
|---|---|---|---|---|
| 2025 | $5,483 | $401,100 | $168,500 | $232,600 |
| 2024 | $5,396 | $389,900 | $162,100 | $227,800 |
| 2023 | $5,360 | $370,900 | $162,100 | $208,800 |
| 2022 | $5,349 | $342,900 | $147,400 | $195,500 |
| 2021 | $5,287 | $310,100 | $141,600 | $168,500 |
| 2020 | $10,984 | $303,500 | $136,200 | $167,300 |
| 2019 | $5,178 | $294,900 | $130,200 | $164,700 |
| 2018 | $10,226 | $276,900 | $130,200 | $146,700 |
| 2017 | $4,871 | $266,200 | $124,100 | $142,100 |
| 2016 | $4,774 | $262,900 | $124,100 | $138,800 |
| 2015 | $4,642 | $261,400 | $123,300 | $138,100 |
| 2014 | $4,459 | $256,700 | $120,700 | $136,000 |
Source: Public Records
Map
Nearby Homes