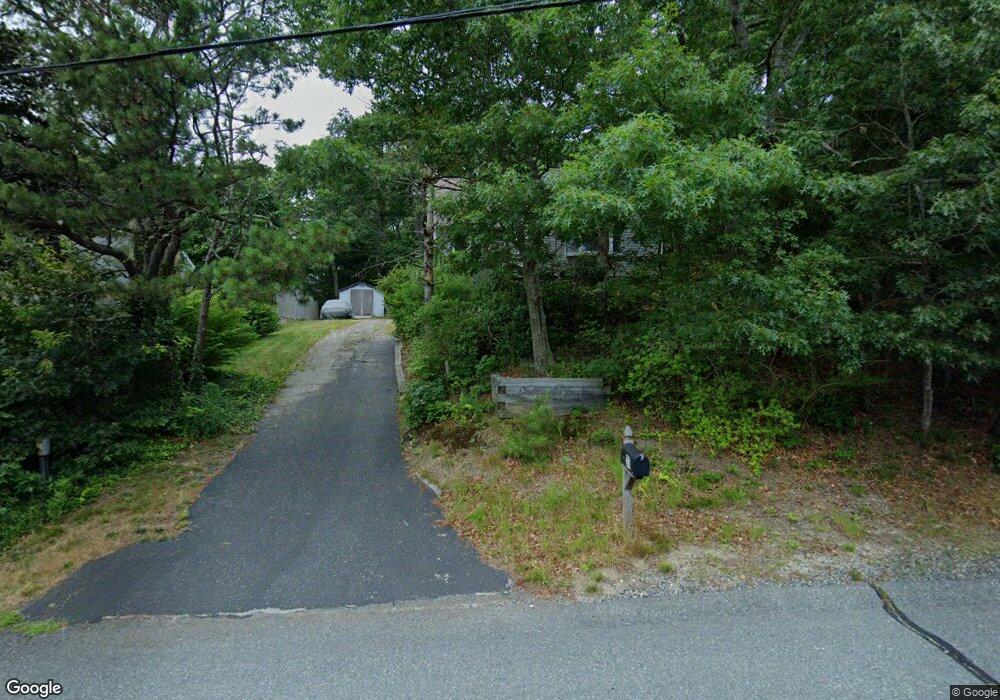
37 Thom Ave Buzzards Bay, MA 02532
Monument Beach NeighborhoodEstimated Value: $511,000 - $613,000
3
Beds
2
Baths
1,501
Sq Ft
$379/Sq Ft
Est. Value
About This Home
This home is located at 37 Thom Ave, Buzzards Bay, MA 02532 and is currently estimated at $569,271, approximately $379 per square foot. 37 Thom Ave is a home located in Barnstable County with nearby schools including Bourne High School, Cadence Academy Preschool - Bourne, and St Margaret Regional School.
Ownership History
Date
Name
Owned For
Owner Type
Purchase Details
Closed on
Jun 2, 2004
Sold by
Frankel Jody M and Frankel Mark D
Bought by
Rye Theodore V
Current Estimated Value
Home Financials for this Owner
Home Financials are based on the most recent Mortgage that was taken out on this home.
Original Mortgage
$244,000
Outstanding Balance
$117,061
Interest Rate
5.94%
Mortgage Type
Purchase Money Mortgage
Estimated Equity
$452,210
Purchase Details
Closed on
Sep 1, 1998
Sold by
Mcgerigle John E and Mcgerigle Joan F
Bought by
Frankel Mark D and Frankel Jody M
Home Financials for this Owner
Home Financials are based on the most recent Mortgage that was taken out on this home.
Original Mortgage
$107,100
Interest Rate
6.9%
Mortgage Type
Purchase Money Mortgage
Create a Home Valuation Report for This Property
The Home Valuation Report is an in-depth analysis detailing your home's value as well as a comparison with similar homes in the area
Home Values in the Area
Average Home Value in this Area
Purchase History
| Date | Buyer | Sale Price | Title Company |
|---|---|---|---|
| Rye Theodore V | $308,000 | -- | |
| Rye Theodore V | $308,000 | -- | |
| Frankel Mark D | $107,000 | -- | |
| Frankel Mark D | $107,000 | -- |
Source: Public Records
Mortgage History
| Date | Status | Borrower | Loan Amount |
|---|---|---|---|
| Open | Rye Theodore V | $244,000 | |
| Closed | Frankel Mark D | $244,000 | |
| Previous Owner | Frankel Mark D | $152,250 | |
| Previous Owner | Frankel Mark D | $107,100 |
Source: Public Records
Tax History Compared to Growth
Tax History
| Year | Tax Paid | Tax Assessment Tax Assessment Total Assessment is a certain percentage of the fair market value that is determined by local assessors to be the total taxable value of land and additions on the property. | Land | Improvement |
|---|---|---|---|---|
| 2025 | $3,741 | $479,000 | $193,400 | $285,600 |
| 2024 | $3,658 | $456,100 | $184,200 | $271,900 |
| 2023 | $3,557 | $403,700 | $163,000 | $240,700 |
| 2022 | $3,386 | $335,600 | $144,300 | $191,300 |
| 2021 | $3,291 | $305,600 | $131,300 | $174,300 |
| 2020 | $8,187 | $291,400 | $130,100 | $161,300 |
| 2019 | $2,968 | $282,400 | $130,100 | $152,300 |
| 2018 | $7,685 | $263,100 | $118,000 | $145,100 |
| 2017 | $6,149 | $246,000 | $116,900 | $129,100 |
| 2016 | $2,474 | $243,500 | $116,900 | $126,600 |
| 2015 | $2,452 | $243,500 | $116,900 | $126,600 |
Source: Public Records
Map
Nearby Homes
- 30 Howard Ave
- 93 Valley Bars Rd
- 18 Douglas Ave
- 12 Beachwood Rd
- 566 Shore Rd
- 16 Amberwood Ct
- 203 County Rd
- 12 Turnberry Rd Unit 12
- 39 Bennets Neck Dr
- 26 Carnoustie Rd
- 13 Laurel Hill Ct
- 4 Hollyhock Knoll Ct Unit 4
- 4 Hollyhock Knoll Ct Unit 4
- 1 Hollyhock Knoll Ct Unit 1
- 5 Sea Knoll Ct
- 41 Portside Dr
- 709 County Rd
- 3 1st St
- 14 Navajo Rd
- 254 Barlows Landing Rd