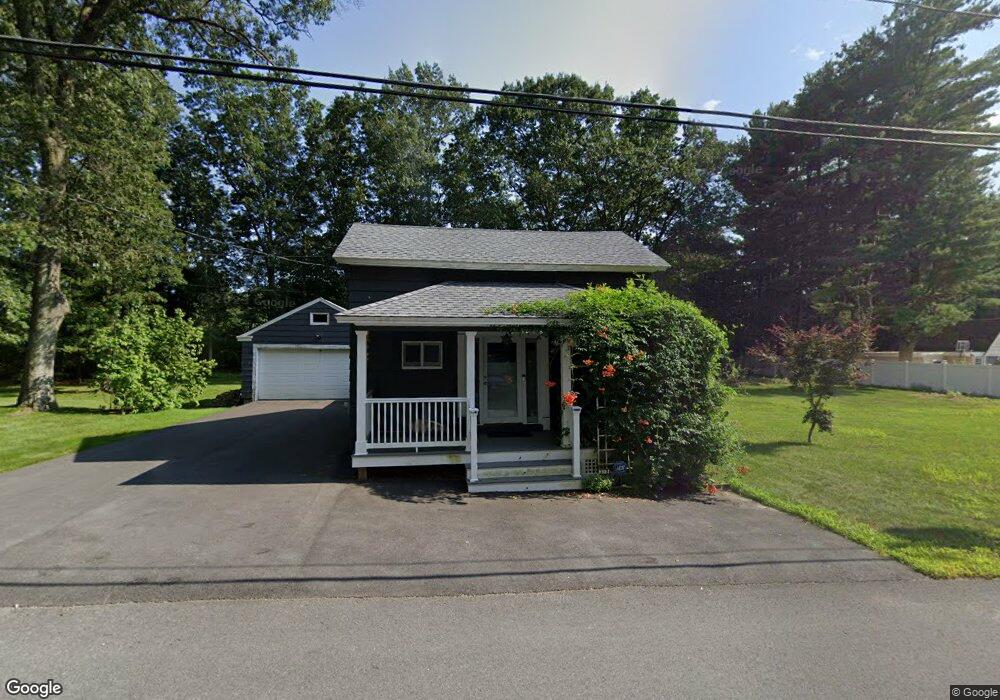
37 Topping Rd Andover, MA 01810
Shawsheen Heights NeighborhoodEstimated Value: $502,151 - $560,000
2
Beds
1
Bath
979
Sq Ft
$540/Sq Ft
Est. Value
About This Home
This home is located at 37 Topping Rd, Andover, MA 01810 and is currently estimated at $529,038, approximately $540 per square foot. 37 Topping Rd is a home located in Essex County with nearby schools including West Elementary School, Andover West Middle School, and Andover High School.
Ownership History
Date
Name
Owned For
Owner Type
Purchase Details
Closed on
Dec 1, 1999
Sold by
Silveri Juliet
Bought by
Gilreath Mark and Gilreath Elizabeth
Current Estimated Value
Purchase Details
Closed on
May 22, 1992
Sold by
Cohen Douglas L
Bought by
Silveri Juliet
Create a Home Valuation Report for This Property
The Home Valuation Report is an in-depth analysis detailing your home's value as well as a comparison with similar homes in the area
Home Values in the Area
Average Home Value in this Area
Purchase History
| Date | Buyer | Sale Price | Title Company |
|---|---|---|---|
| Gilreath Mark | $364,000 | -- | |
| Gilreath Mark | $364,000 | -- | |
| Silveri Juliet | $115,190 | -- | |
| Silveri Juliet | $115,190 | -- |
Source: Public Records
Mortgage History
| Date | Status | Borrower | Loan Amount |
|---|---|---|---|
| Open | Silveri Juliet | $171,200 | |
| Closed | Silveri Juliet | $25,000 |
Source: Public Records
Tax History
| Year | Tax Paid | Tax Assessment Tax Assessment Total Assessment is a certain percentage of the fair market value that is determined by local assessors to be the total taxable value of land and additions on the property. | Land | Improvement |
|---|---|---|---|---|
| 2024 | $5,448 | $423,000 | $254,800 | $168,200 |
| 2023 | $5,207 | $381,200 | $229,400 | $151,800 |
| 2022 | $4,825 | $330,500 | $199,400 | $131,100 |
| 2021 | $4,615 | $301,800 | $181,400 | $120,400 |
| 2020 | $4,252 | $283,300 | $176,800 | $106,500 |
| 2019 | $4,202 | $275,200 | $171,500 | $103,700 |
| 2018 | $4,071 | $260,300 | $164,800 | $95,500 |
| 2017 | $3,889 | $256,200 | $161,600 | $94,600 |
| 2016 | $3,797 | $256,200 | $161,600 | $94,600 |
| 2015 | $3,662 | $244,600 | $155,300 | $89,300 |
Source: Public Records
Map
Nearby Homes
- 102 Weare St
- 116 Weare St
- 12B Stevens St
- 10 Dartmouth Rd
- 43 Gorham St
- 34 Martingale Ln Unit 34
- 53 Martingale Ln
- 354 N Main St Unit 204
- 42 York St
- 21 Clubview Dr Unit 21
- 24 Inman St Unit 4
- 11 W Hawley St
- 341 S Broadway- Parcel II
- 87-87A Brookfield St
- 16 Balmoral St Unit 214
- 34 Beaconsfield St
- 11 Swan Ln Unit 11
- 17 Carisbrooke St
- 28 Stirling St
- 31 Garfield St
Your Personal Tour Guide
Ask me questions while you tour the home.