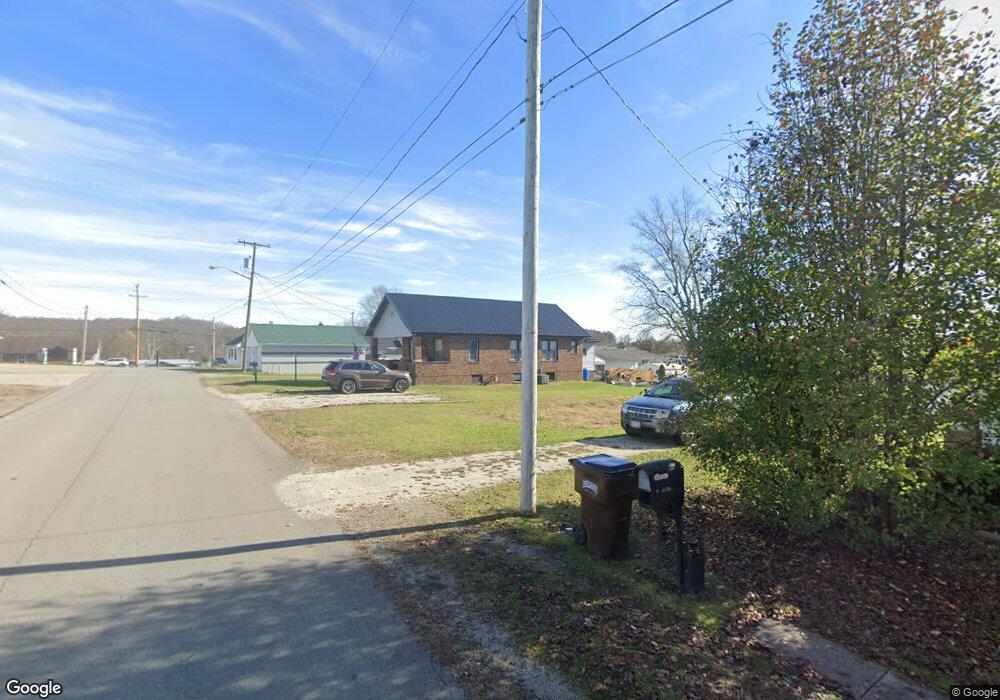
37 Tripp St South Webster, OH 45682
Estimated Value: $94,000 - $123,000
3
Beds
1
Bath
960
Sq Ft
$114/Sq Ft
Est. Value
About This Home
This home is located at 37 Tripp St, South Webster, OH 45682 and is currently estimated at $109,651, approximately $114 per square foot. 37 Tripp St is a home located in Scioto County with nearby schools including Bloom-Vernon Elementary School and South Webster Junior/Senior High School.
Ownership History
Date
Name
Owned For
Owner Type
Purchase Details
Closed on
May 5, 2023
Sold by
37 Tripp Street Llc
Bought by
Hankins Darryl and Hankins Cheryl
Current Estimated Value
Home Financials for this Owner
Home Financials are based on the most recent Mortgage that was taken out on this home.
Original Mortgage
$80,000
Outstanding Balance
$71,687
Interest Rate
5.89%
Mortgage Type
New Conventional
Estimated Equity
$37,964
Purchase Details
Closed on
Feb 7, 2022
Sold by
Patrick Joseph and Patrick Harold
Bought by
37 Tripp Street Llc
Purchase Details
Closed on
Oct 14, 2013
Sold by
Joseph Karon and Joseph Harold Patrick
Bought by
Joseph Karon and Brady Sharon
Purchase Details
Closed on
Nov 30, 2004
Bought by
Joseph Karon
Purchase Details
Closed on
Mar 4, 2003
Sold by
Martin Lena
Bought by
Martin Lena
Purchase Details
Closed on
May 8, 2000
Sold by
Martin Harry C + Lena M
Bought by
Martin Lena
Create a Home Valuation Report for This Property
The Home Valuation Report is an in-depth analysis detailing your home's value as well as a comparison with similar homes in the area
Home Values in the Area
Average Home Value in this Area
Purchase History
| Date | Buyer | Sale Price | Title Company |
|---|---|---|---|
| Hankins Darryl | $85,000 | None Listed On Document | |
| 37 Tripp Street Llc | -- | None Listed On Document | |
| Joseph Karon | -- | -- | |
| Joseph Karon | -- | -- | |
| Martin Lena | -- | -- | |
| Martin Lena | -- | -- |
Source: Public Records
Mortgage History
| Date | Status | Borrower | Loan Amount |
|---|---|---|---|
| Open | Hankins Darryl | $80,000 |
Source: Public Records
Tax History Compared to Growth
Tax History
| Year | Tax Paid | Tax Assessment Tax Assessment Total Assessment is a certain percentage of the fair market value that is determined by local assessors to be the total taxable value of land and additions on the property. | Land | Improvement |
|---|---|---|---|---|
| 2024 | $1,013 | $18,220 | $2,610 | $15,610 |
| 2023 | $1,013 | $18,220 | $2,610 | $15,610 |
| 2022 | $447 | $18,220 | $2,610 | $15,610 |
| 2021 | $294 | $14,770 | $2,310 | $12,460 |
| 2020 | $297 | $14,770 | $2,310 | $12,460 |
| 2019 | $300 | $13,620 | $2,080 | $11,540 |
| 2018 | $249 | $13,620 | $2,080 | $11,540 |
| 2017 | $247 | $13,620 | $2,080 | $11,540 |
| 2016 | $2,933 | $12,670 | $1,940 | $10,730 |
| 2015 | $178 | $12,670 | $1,940 | $10,730 |
| 2013 | -- | $12,670 | $1,940 | $10,730 |
Source: Public Records
Map
Nearby Homes
- 101 Mittendorf St
- 302 Essman Sugar Camp Rd
- 501 Webster St
- 0 Bear Run Rd Unit 24453891
- 0 Bear Run Rd Unit 24273256
- 0 Bear Run Rd Unit 11545115
- 929 Jackson Furnace Rd
- 0 Neff Bratton Rd
- 947 Oak Hill Branch Rd
- 0 Dennison Rd
- 0 Burton Rd
- 0 Burton Rd Unit 1849840
- 15253 Ohio 140
- 1453 Jackson Furnace Rd
- 1453 Jackson Furnace Rd Unit 35AC
- 1453 Jackson Furnace Rd Unit 132AC
- 1453 Jackson Furnace Rd Unit 70AC
- 3650 Tick Ridge Rd
- 810 Egypt Rd
- 1065 Kittle Rd