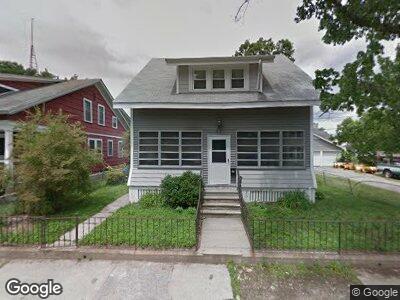
37 W Forest St Lowell, MA 01851
Highlands NeighborhoodEstimated Value: $570,000 - $625,000
3
Beds
2
Baths
2,236
Sq Ft
$267/Sq Ft
Est. Value
About This Home
This home is located at 37 W Forest St, Lowell, MA 01851 and is currently estimated at $596,661, approximately $266 per square foot. 37 W Forest St is a home located in Middlesex County with nearby schools including Dr. Gertrude Bailey Elementary School, Charles W. Morey Elementary School, and Abraham Lincoln Elementary School.
Ownership History
Date
Name
Owned For
Owner Type
Purchase Details
Closed on
May 31, 2005
Sold by
Mcdonough Elizabeth A and Mcdonough Geoffrey T
Bought by
Thomas James M
Current Estimated Value
Home Financials for this Owner
Home Financials are based on the most recent Mortgage that was taken out on this home.
Original Mortgage
$255,200
Interest Rate
5.94%
Mortgage Type
Purchase Money Mortgage
Purchase Details
Closed on
Jul 10, 2001
Sold by
Cook James R and Cook Colleen A
Bought by
Mcdonough Geoffrey T and Mcdonough Elizabeth A
Home Financials for this Owner
Home Financials are based on the most recent Mortgage that was taken out on this home.
Original Mortgage
$230,912
Interest Rate
7.21%
Mortgage Type
Purchase Money Mortgage
Purchase Details
Closed on
Nov 30, 1990
Sold by
Gagnon Est Alfred E
Bought by
Cook James R
Create a Home Valuation Report for This Property
The Home Valuation Report is an in-depth analysis detailing your home's value as well as a comparison with similar homes in the area
Home Values in the Area
Average Home Value in this Area
Purchase History
| Date | Buyer | Sale Price | Title Company |
|---|---|---|---|
| Thomas James M | $319,000 | -- | |
| Thomas James M | $319,000 | -- | |
| Mcdonough Geoffrey T | $240,000 | -- | |
| Mcdonough Geoffrey T | $240,000 | -- | |
| Cook James R | $40,000 | -- | |
| Cook James R | $40,000 | -- | |
| Cook James R | $40,000 | -- |
Source: Public Records
Mortgage History
| Date | Status | Borrower | Loan Amount |
|---|---|---|---|
| Open | Thomas James M | $150,000 | |
| Closed | Thomas James M | $288,500 | |
| Closed | Thomas James M | $255,200 | |
| Previous Owner | Cook James R | $230,912 |
Source: Public Records
Tax History Compared to Growth
Tax History
| Year | Tax Paid | Tax Assessment Tax Assessment Total Assessment is a certain percentage of the fair market value that is determined by local assessors to be the total taxable value of land and additions on the property. | Land | Improvement |
|---|---|---|---|---|
| 2025 | $5,960 | $519,200 | $233,400 | $285,800 |
| 2024 | $5,717 | $480,000 | $210,100 | $269,900 |
| 2023 | $5,363 | $431,800 | $182,700 | $249,100 |
| 2022 | $5,005 | $394,400 | $166,100 | $228,300 |
| 2021 | $4,675 | $347,300 | $144,400 | $202,900 |
| 2020 | $4,266 | $319,300 | $131,100 | $188,200 |
| 2019 | $4,149 | $295,500 | $132,700 | $162,800 |
| 2018 | $4,061 | $282,200 | $126,500 | $155,700 |
| 2017 | $3,908 | $261,900 | $115,000 | $146,900 |
| 2016 | $3,654 | $241,000 | $106,100 | $134,900 |
| 2015 | $3,450 | $222,900 | $101,900 | $121,000 |
| 2013 | $3,397 | $226,300 | $119,100 | $107,200 |
Source: Public Records
Map
Nearby Homes
- 37 W Forest St
- 41 W Forest St
- 27 W Forest St
- 44 Royalston Ave
- 38 Royalston Ave
- 32 W Forest St
- 40 W Forest St
- 19 W Forest St Unit 2
- 17 W Forest St
- 17 W Forest St Unit 1st Floor
- 17 W Forest St Unit 17
- 32 Royalston Ave
- 28 W Forest St
- 11 Rose Ave
- 53 W Forest St
- 48 W Forest St
- 15 Clifford St
- 22 Rose Ave
- 11 W Forest St
- 11 W Forest St Unit 11-15