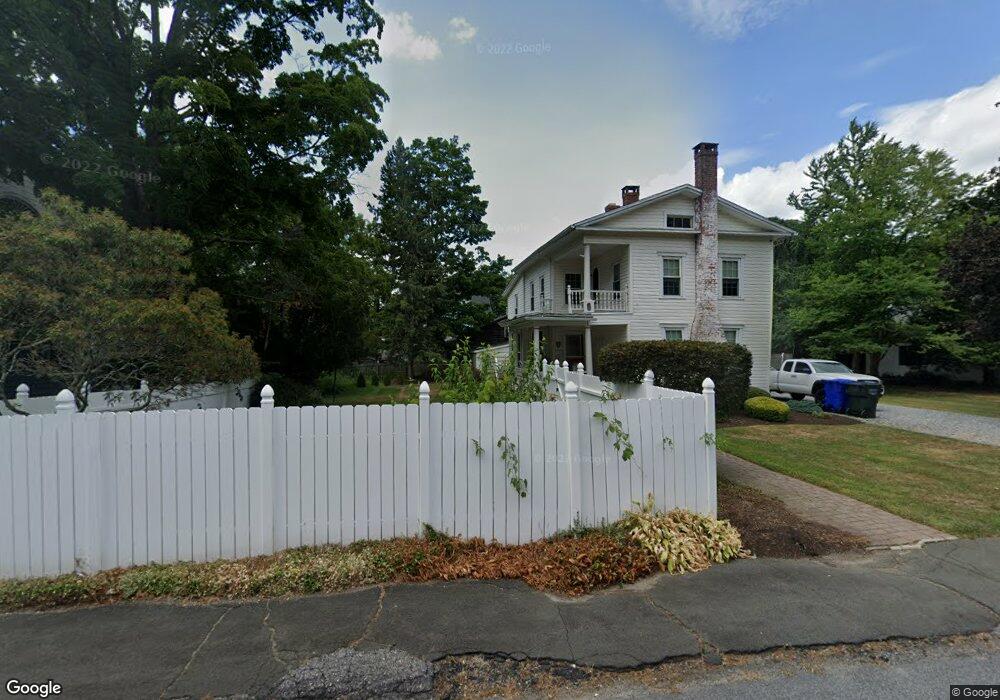
37 Walnut St Winsted, CT 06098
Estimated Value: $224,000 - $294,179
3
Beds
2
Baths
1,684
Sq Ft
$160/Sq Ft
Est. Value
About This Home
This home is located at 37 Walnut St, Winsted, CT 06098 and is currently estimated at $269,045, approximately $159 per square foot. 37 Walnut St is a home located in Litchfield County with nearby schools including St Anthony School.
Ownership History
Date
Name
Owned For
Owner Type
Purchase Details
Closed on
Jun 3, 2011
Sold by
Household Realty Corp
Bought by
Nebel Gail
Current Estimated Value
Home Financials for this Owner
Home Financials are based on the most recent Mortgage that was taken out on this home.
Original Mortgage
$104,300
Outstanding Balance
$72,640
Interest Rate
4.85%
Estimated Equity
$196,405
Purchase Details
Closed on
Jan 19, 2011
Sold by
Honeycutt Jerry M
Bought by
Household Realty Corp
Create a Home Valuation Report for This Property
The Home Valuation Report is an in-depth analysis detailing your home's value as well as a comparison with similar homes in the area
Home Values in the Area
Average Home Value in this Area
Purchase History
| Date | Buyer | Sale Price | Title Company |
|---|---|---|---|
| Nebel Gail | $109,900 | -- | |
| Nebel Gail | $109,900 | -- | |
| Household Realty Corp | -- | -- | |
| Household Realty Corp | -- | -- |
Source: Public Records
Mortgage History
| Date | Status | Borrower | Loan Amount |
|---|---|---|---|
| Open | Nebel Gail | $104,300 | |
| Closed | Household Realty Corp | $104,300 | |
| Previous Owner | Household Realty Corp | $13,244 |
Source: Public Records
Tax History Compared to Growth
Tax History
| Year | Tax Paid | Tax Assessment Tax Assessment Total Assessment is a certain percentage of the fair market value that is determined by local assessors to be the total taxable value of land and additions on the property. | Land | Improvement |
|---|---|---|---|---|
| 2025 | $4,592 | $157,430 | $33,110 | $124,320 |
| 2024 | $4,288 | $157,430 | $33,110 | $124,320 |
| 2023 | $4,155 | $157,430 | $33,110 | $124,320 |
| 2022 | $3,740 | $111,510 | $24,080 | $87,430 |
| 2021 | $3,740 | $111,510 | $24,080 | $87,430 |
| 2020 | $3,740 | $111,510 | $24,080 | $87,430 |
| 2019 | $3,740 | $111,510 | $24,080 | $87,430 |
| 2018 | $3,740 | $111,510 | $24,080 | $87,430 |
| 2017 | $3,557 | $106,050 | $24,080 | $81,970 |
| 2016 | $3,557 | $106,050 | $24,080 | $81,970 |
| 2015 | $3,468 | $106,050 | $24,080 | $81,970 |
| 2014 | $3,384 | $106,050 | $24,080 | $81,970 |
Source: Public Records
Map
Nearby Homes