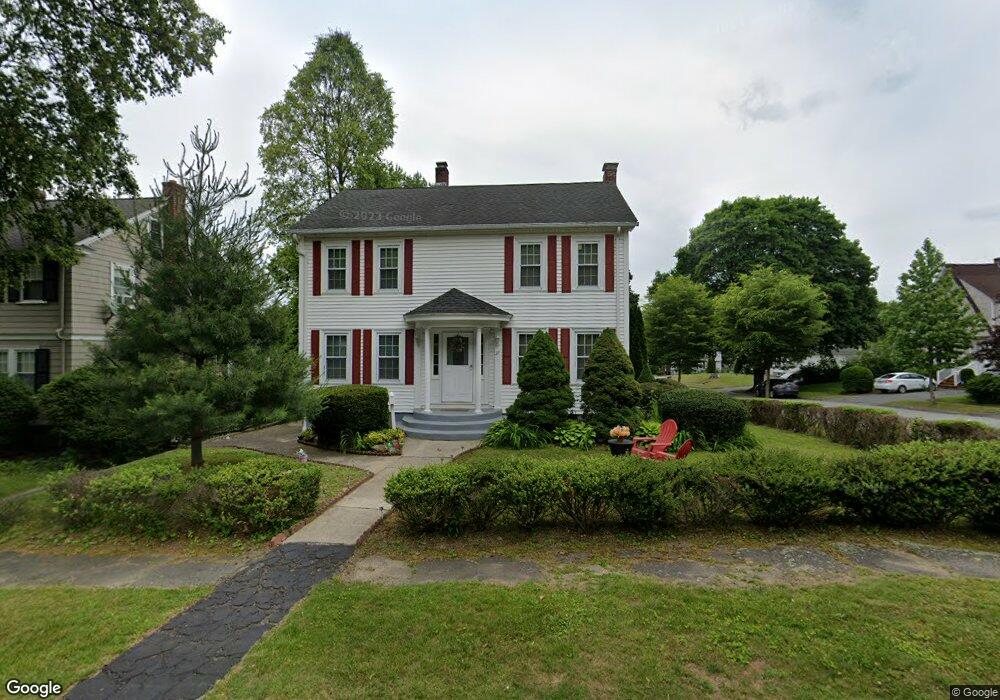
37 Wamsutta Ave Worcester, MA 01602
Tatnuck NeighborhoodEstimated Value: $436,000 - $495,000
4
Beds
2
Baths
1,674
Sq Ft
$280/Sq Ft
Est. Value
About This Home
This home is located at 37 Wamsutta Ave, Worcester, MA 01602 and is currently estimated at $468,594, approximately $279 per square foot. 37 Wamsutta Ave is a home located in Worcester County with nearby schools including Chandler Magnet, Jacob Hiatt Magnet School, and May Street Elementary School.
Ownership History
Date
Name
Owned For
Owner Type
Purchase Details
Closed on
Jul 18, 2002
Sold by
Est Pierce Helen R and Pierce Jack W
Bought by
Spahillari Xhemil and Spahillari Roza
Current Estimated Value
Home Financials for this Owner
Home Financials are based on the most recent Mortgage that was taken out on this home.
Original Mortgage
$142,000
Outstanding Balance
$60,282
Interest Rate
6.73%
Mortgage Type
Purchase Money Mortgage
Estimated Equity
$408,312
Create a Home Valuation Report for This Property
The Home Valuation Report is an in-depth analysis detailing your home's value as well as a comparison with similar homes in the area
Home Values in the Area
Average Home Value in this Area
Purchase History
| Date | Buyer | Sale Price | Title Company |
|---|---|---|---|
| Spahillari Xhemil | $177,500 | -- |
Source: Public Records
Mortgage History
| Date | Status | Borrower | Loan Amount |
|---|---|---|---|
| Open | Spahillari Xhemil | $142,000 |
Source: Public Records
Tax History Compared to Growth
Tax History
| Year | Tax Paid | Tax Assessment Tax Assessment Total Assessment is a certain percentage of the fair market value that is determined by local assessors to be the total taxable value of land and additions on the property. | Land | Improvement |
|---|---|---|---|---|
| 2025 | $5,339 | $404,800 | $118,300 | $286,500 |
| 2024 | $5,236 | $380,800 | $118,300 | $262,500 |
| 2023 | $5,023 | $350,300 | $102,900 | $247,400 |
| 2022 | $4,625 | $304,100 | $82,300 | $221,800 |
| 2021 | $4,511 | $277,100 | $65,900 | $211,200 |
| 2020 | $4,374 | $257,300 | $65,900 | $191,400 |
| 2019 | $4,210 | $233,900 | $59,300 | $174,600 |
| 2018 | $4,189 | $221,500 | $59,300 | $162,200 |
| 2017 | $4,030 | $209,700 | $59,300 | $150,400 |
| 2016 | $3,984 | $193,300 | $43,300 | $150,000 |
| 2015 | $3,880 | $193,300 | $43,300 | $150,000 |
| 2014 | $3,777 | $193,300 | $43,300 | $150,000 |
Source: Public Records
Map
Nearby Homes
- 250 May St
- 41 Walnut Hill Dr
- 2 Carlisle St
- 96 June St Unit 3
- 24 Hadwen Rd
- 16 Sherwood Rd
- 371 Chandler St Unit 2
- 336 Lovell St
- 71 Glendale St
- 53 Howland Terrace
- 40 Howland Terrace
- 34 Monroe Ave
- 5 Swan Ave
- 15 Circuit Ave E
- 22 Roy St
- 415 Mill St
- 23 Roy St
- 114 Lovell St
- 45 Fourth St
- 45 Fourth St Unit Right