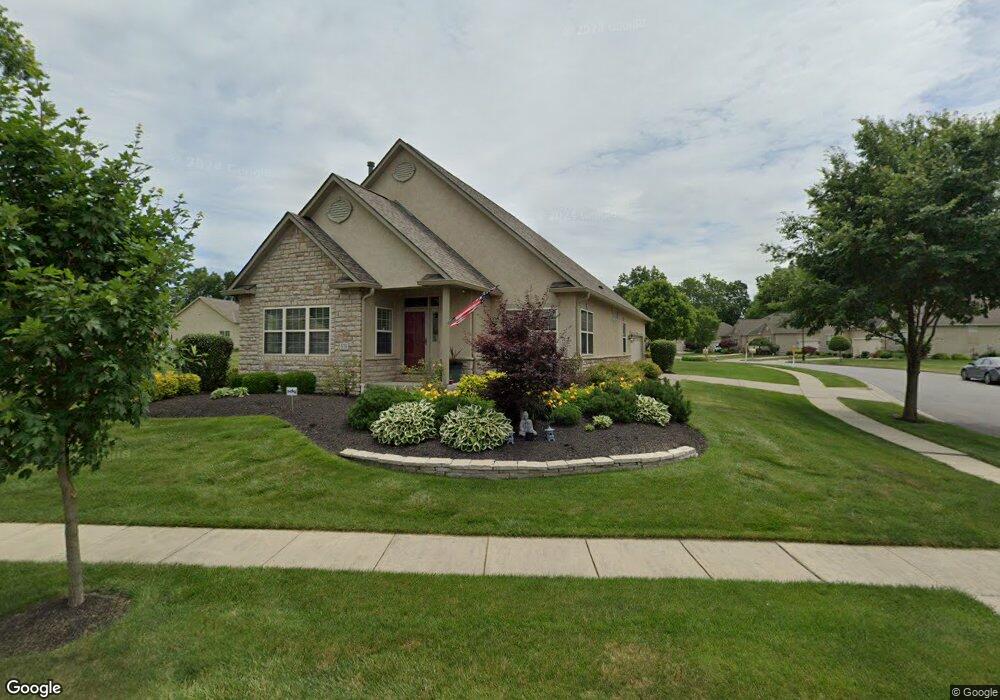
370 Daner Rd Columbus, OH 43213
Olde Orchard NeighborhoodEstimated Value: $384,300 - $422,000
3
Beds
3
Baths
1,952
Sq Ft
$205/Sq Ft
Est. Value
About This Home
This home is located at 370 Daner Rd, Columbus, OH 43213 and is currently estimated at $400,825, approximately $205 per square foot. 370 Daner Rd is a home located in Franklin County with nearby schools including Waggoner Road Elementary School, Waggoner Road Junior High School, and Patriot Preparatory Academy.
Ownership History
Date
Name
Owned For
Owner Type
Purchase Details
Closed on
May 17, 2010
Sold by
Logan Craig A
Bought by
Logan Craig A and Gay Stephen D
Current Estimated Value
Home Financials for this Owner
Home Financials are based on the most recent Mortgage that was taken out on this home.
Original Mortgage
$250,196
Outstanding Balance
$168,690
Interest Rate
5.25%
Mortgage Type
FHA
Estimated Equity
$232,135
Purchase Details
Closed on
Mar 26, 2010
Sold by
Gay Stephen D
Bought by
Logan Craig A
Home Financials for this Owner
Home Financials are based on the most recent Mortgage that was taken out on this home.
Original Mortgage
$250,196
Outstanding Balance
$168,690
Interest Rate
5.25%
Mortgage Type
FHA
Estimated Equity
$232,135
Purchase Details
Closed on
Aug 25, 2008
Sold by
The Home Sla Co Of Youngstown
Bought by
Logan Craig A and Gay Stephen D
Home Financials for this Owner
Home Financials are based on the most recent Mortgage that was taken out on this home.
Original Mortgage
$251,678
Interest Rate
6.66%
Mortgage Type
FHA
Purchase Details
Closed on
May 7, 2008
Sold by
Columbus Contractor Co
Bought by
The Home Sla Co Of Youngstown Ohio
Create a Home Valuation Report for This Property
The Home Valuation Report is an in-depth analysis detailing your home's value as well as a comparison with similar homes in the area
Home Values in the Area
Average Home Value in this Area
Purchase History
| Date | Buyer | Sale Price | Title Company |
|---|---|---|---|
| Logan Craig A | -- | Expedient | |
| Logan Craig A | $106,500 | Expedient | |
| Logan Craig A | $255,000 | Talon Group | |
| The Home Sla Co Of Youngstown Ohio | -- | Fati |
Source: Public Records
Mortgage History
| Date | Status | Borrower | Loan Amount |
|---|---|---|---|
| Open | Logan Craig A | $250,196 | |
| Previous Owner | Logan Craig A | $251,678 |
Source: Public Records
Tax History Compared to Growth
Tax History
| Year | Tax Paid | Tax Assessment Tax Assessment Total Assessment is a certain percentage of the fair market value that is determined by local assessors to be the total taxable value of land and additions on the property. | Land | Improvement |
|---|---|---|---|---|
| 2024 | $5,298 | $130,060 | $29,750 | $100,310 |
| 2023 | $5,216 | $130,060 | $29,750 | $100,310 |
| 2022 | $4,405 | $86,450 | $16,800 | $69,650 |
| 2021 | $4,419 | $86,450 | $16,800 | $69,650 |
| 2020 | $4,466 | $86,450 | $16,800 | $69,650 |
| 2019 | $4,391 | $73,890 | $14,000 | $59,890 |
| 2018 | $4,844 | $73,890 | $14,000 | $59,890 |
| 2017 | $4,845 | $73,890 | $14,000 | $59,890 |
| 2016 | $5,301 | $79,880 | $12,010 | $67,870 |
| 2015 | $5,299 | $79,880 | $12,010 | $67,870 |
| 2014 | $5,329 | $79,880 | $12,010 | $67,870 |
| 2013 | $2,726 | $84,070 | $12,635 | $71,435 |
Source: Public Records
Map
Nearby Homes
- 541 Woodingham Place Unit 2-C
- 6193 Stornoway Dr S Unit 6193
- 557 Woodingham Place Unit 1A
- 117 Stornoway Dr E
- 6198 Stornoway Dr S Unit 6198
- 6279 Braiden Ct Unit 10B
- 6056 Naughten Pond Dr
- 6560 Schenk Ave
- 6052 Naughten Pond Dr
- 85 Stornoway Dr W Unit 85
- 6040 Naughten Pond Dr
- Oxford Plan at Icon Villas at McNaughten
- Ashton Plan at Icon Villas at McNaughten
- 6610 Olivetree Ct
- 147 Shadymere Ln Unit 5
- 142 Villamere Dr Unit 6
- 6258 Peach Tree Rd
- 6231 Peach Tree Rd
- 6033 McNaughten Grove Ln
- 696 Hunt Valley Dr
- 6252 Marias Point Ln
- 6277 Kinver Edge Way
- 6239 Marias Point Ln
- 6233 Marias Point Ln
- 6222 Marias Point Ln
- 6260 Marias Point Ln
- 6245 Marias Point Ln
- 6289 Kinver Edge Way
- 6265 Kinver Edge Way
- 6253 Marias Point Ln
- 6295 Kinver Edge Way
- 328 McNaughten Rd
- 388 Daner Rd
- 6241 Kinver Edge Way
- 6216 Marias Point Ln
- 5258 Kinver Edge Way
- 6235 Kinver Edge Way
- 394 Daner Rd
- 6265 Marias Point Ln
- 6364 Little Deer Ln