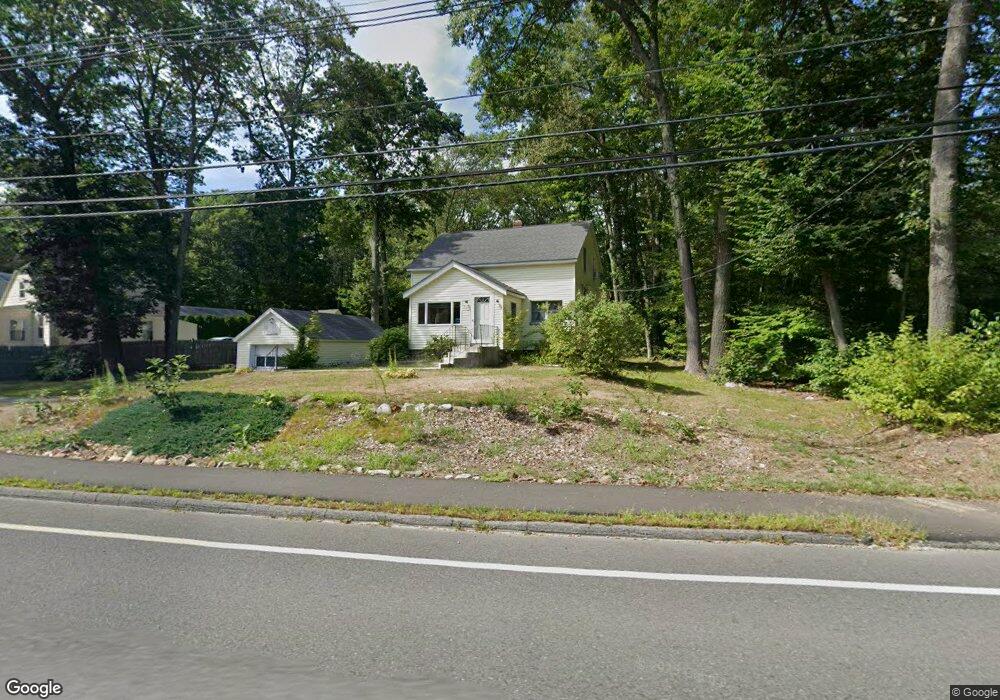
370 Maple St Winchendon, MA 01475
Estimated Value: $301,000 - $383,000
3
Beds
1
Bath
1,508
Sq Ft
$217/Sq Ft
Est. Value
About This Home
This home is located at 370 Maple St, Winchendon, MA 01475 and is currently estimated at $327,406, approximately $217 per square foot. 370 Maple St is a home located in Worcester County with nearby schools including Memorial, Toy Town Elementary School, and The Winchendon School.
Ownership History
Date
Name
Owned For
Owner Type
Purchase Details
Closed on
Jul 3, 2006
Sold by
Jalbert Jason R
Bought by
Jalbert Jason R and Johnson Amanda
Current Estimated Value
Purchase Details
Closed on
Jun 20, 2006
Sold by
Option One Mtg Corp and Boisse
Bought by
Jalbert Jason R
Purchase Details
Closed on
Aug 30, 2002
Sold by
Hunt Elizabeth R and Hunt Lorraine M
Bought by
Boisse Cory F
Home Financials for this Owner
Home Financials are based on the most recent Mortgage that was taken out on this home.
Original Mortgage
$120,720
Interest Rate
6.55%
Mortgage Type
Purchase Money Mortgage
Purchase Details
Closed on
Jun 26, 1989
Sold by
Brooks Leonard
Bought by
Hunt Elizabeth
Create a Home Valuation Report for This Property
The Home Valuation Report is an in-depth analysis detailing your home's value as well as a comparison with similar homes in the area
Home Values in the Area
Average Home Value in this Area
Purchase History
| Date | Buyer | Sale Price | Title Company |
|---|---|---|---|
| Jalbert Jason R | -- | -- | |
| Jalbert Jason R | -- | -- | |
| Jalbert Jason R | $154,000 | -- | |
| Jalbert Jason R | $154,000 | -- | |
| Boisse Cory F | $150,900 | -- | |
| Boisse Cory F | $150,900 | -- | |
| Hunt Elizabeth | $105,000 | -- | |
| Hunt Elizabeth | $105,000 | -- |
Source: Public Records
Mortgage History
| Date | Status | Borrower | Loan Amount |
|---|---|---|---|
| Previous Owner | Hunt Elizabeth | $120,720 | |
| Previous Owner | Hunt Elizabeth | $98,252 |
Source: Public Records
Tax History
| Year | Tax Paid | Tax Assessment Tax Assessment Total Assessment is a certain percentage of the fair market value that is determined by local assessors to be the total taxable value of land and additions on the property. | Land | Improvement |
|---|---|---|---|---|
| 2025 | $2,921 | $248,600 | $34,100 | $214,500 |
| 2024 | $2,823 | $225,100 | $32,600 | $192,500 |
| 2023 | $2,963 | $221,100 | $31,900 | $189,200 |
| 2022 | $2,839 | $187,900 | $40,200 | $147,700 |
| 2021 | $2,572 | $163,600 | $36,600 | $127,000 |
| 2020 | $2,499 | $153,500 | $34,100 | $119,400 |
| 2019 | $2,358 | $141,100 | $31,500 | $109,600 |
| 2018 | $2,200 | $126,800 | $29,400 | $97,400 |
| 2017 | $2,077 | $115,600 | $33,400 | $82,200 |
| 2016 | $1,949 | $111,800 | $31,800 | $80,000 |
| 2015 | $1,869 | $111,800 | $31,800 | $80,000 |
| 2014 | $1,760 | $110,300 | $33,600 | $76,700 |
Source: Public Records
Map
Nearby Homes
- 366 Maple St
- 364 Maple St
- 380 Maple St
- 363 Maple St Unit 365
- 373 Maple St Unit 375
- 369 Maple St Unit 371
- 360 Maple St
- 357 Maple St Unit 359
- 388 Maple St
- 348 Maple St
- 20 Lakeshore Dr
- 346 Maple St
- 385 Maple St
- 390 Maple St
- 30 Lakeshore Dr
- 342 Maple St
- 389 Maple St
- 40 Lakeshore Dr
- 15 Lakeshore Dr
- 391 Maple St
Your Personal Tour Guide
Ask me questions while you tour the home.