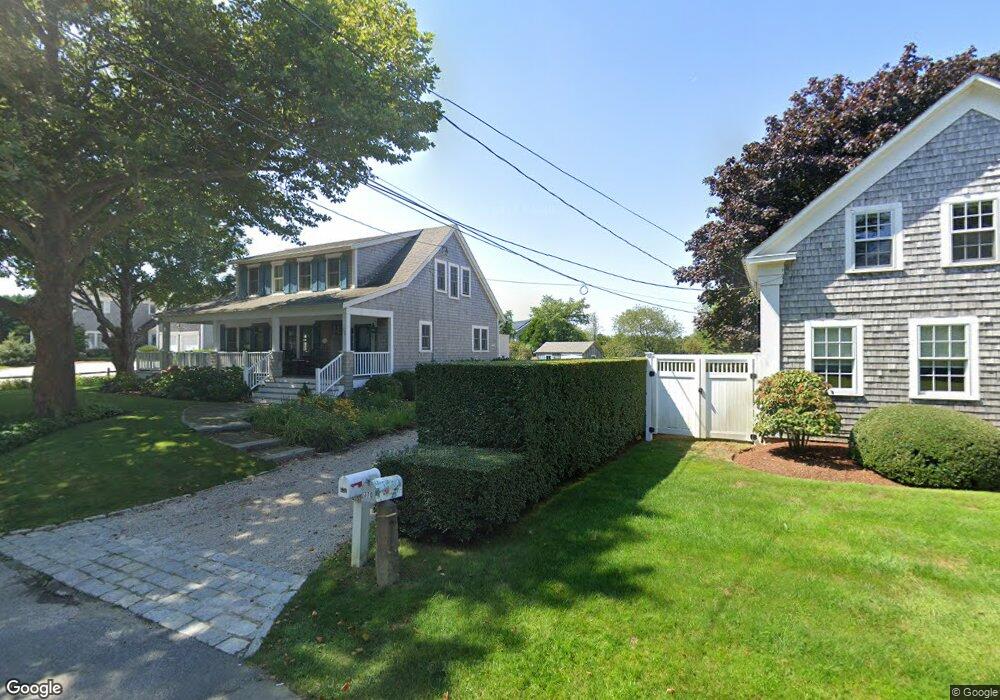
370 Stage Harbor Rd Chatham, MA 02633
Chatham Village NeighborhoodEstimated Value: $2,048,000 - $3,011,000
3
Beds
2
Baths
1,450
Sq Ft
$1,736/Sq Ft
Est. Value
About This Home
This home is located at 370 Stage Harbor Rd, Chatham, MA 02633 and is currently estimated at $2,516,998, approximately $1,735 per square foot. 370 Stage Harbor Rd is a home located in Barnstable County with nearby schools including Chatham Elementary School, Harwich Elementary School, and Monomoy Regional Middle School.
Ownership History
Date
Name
Owned For
Owner Type
Purchase Details
Closed on
Jul 31, 2024
Sold by
Carroll Michael H and Carroll Mary E
Bought by
Michael Hlary Carroll T and Michael Carroll
Current Estimated Value
Purchase Details
Closed on
Jan 21, 2009
Sold by
Rothfuss Frederick W and Rothfuss Marylou V
Bought by
Carroll Mary E and Carroll Michael H
Home Financials for this Owner
Home Financials are based on the most recent Mortgage that was taken out on this home.
Original Mortgage
$415,000
Interest Rate
5.51%
Mortgage Type
Purchase Money Mortgage
Purchase Details
Closed on
May 19, 2006
Sold by
Bainbridge Mary M and Bainbridge Robert H
Bought by
Rothfuss Frederick W and Rothfuss Marylou V
Home Financials for this Owner
Home Financials are based on the most recent Mortgage that was taken out on this home.
Original Mortgage
$672,000
Interest Rate
6.42%
Mortgage Type
Purchase Money Mortgage
Purchase Details
Closed on
Nov 3, 1997
Sold by
Harris Florence E
Bought by
Bainbridge Robert H
Create a Home Valuation Report for This Property
The Home Valuation Report is an in-depth analysis detailing your home's value as well as a comparison with similar homes in the area
Home Values in the Area
Average Home Value in this Area
Purchase History
| Date | Buyer | Sale Price | Title Company |
|---|---|---|---|
| Michael Hlary Carroll T | -- | None Available | |
| Michael Hlary Carroll T | -- | None Available | |
| Carroll Mary E | $700,000 | -- | |
| Rothfuss Frederick W | $840,000 | -- | |
| Bainbridge Robert H | $158,250 | -- | |
| Carroll Mary E | $700,000 | -- | |
| Rothfuss Frederick W | $840,000 | -- | |
| Bainbridge Robert H | $158,250 | -- |
Source: Public Records
Mortgage History
| Date | Status | Borrower | Loan Amount |
|---|---|---|---|
| Previous Owner | Carroll Mary E | $415,000 | |
| Previous Owner | Rothfuss Frederick W | $672,000 |
Source: Public Records
Tax History Compared to Growth
Tax History
| Year | Tax Paid | Tax Assessment Tax Assessment Total Assessment is a certain percentage of the fair market value that is determined by local assessors to be the total taxable value of land and additions on the property. | Land | Improvement |
|---|---|---|---|---|
| 2025 | $6,808 | $1,962,100 | $1,139,600 | $822,500 |
| 2024 | $6,863 | $1,922,300 | $1,146,800 | $775,500 |
| 2023 | $6,446 | $1,661,400 | $955,600 | $705,800 |
| 2022 | $6,471 | $1,400,700 | $955,600 | $445,100 |
| 2021 | $5,753 | $1,155,200 | $977,200 | $178,000 |
| 2020 | $5,560 | $1,153,500 | $977,200 | $176,300 |
| 2019 | $5,297 | $1,092,100 | $913,500 | $178,600 |
| 2018 | $5,514 | $1,132,200 | $974,400 | $157,800 |
| 2017 | $5,353 | $1,064,300 | $945,800 | $118,500 |
| 2016 | $5,217 | $1,039,300 | $923,100 | $116,200 |
| 2015 | $4,067 | $815,100 | $700,700 | $114,400 |
| 2014 | $4,132 | $813,400 | $700,700 | $112,700 |
Source: Public Records
Map
Nearby Homes
- 404 Stage Harbor Rd
- 292 Stage Harbor Rd
- 287 Cedar St
- 85 Cedar St
- 86 Champlain Rd
- 12 Pond St
- 346 Morris Island Rd
- 58 Oyster Bluff
- 99 Uncle Alberts Drive Extension
- 425 Main St Unit D
- 425 Main St Unit D
- 745 Main St
- 450 Main St
- 409 Main St
- 3 Oyster Dr
- 32 Sunset Ln
- 36 Moonbeam Ln
- 213 Main St
- 30 Tisquantum Rd
- 14 Pond View Ln
- 372 Stage Harbor Rd
- 396 Stage Harbor Rd
- 376 Stage Harbor Rd
- 95 Independence Ln
- 368 Stage Harbor Rd
- 110 Sea Shell
- 418712 Nauset Beach
- 111 Independence Ln
- 408 Stage Harbor Rd
- 340 Stage Harbor Rd
- 36 Honeysuckle Ln
- 391 Stage Harbor Rd
- 414 Stage Harbor Rd
- 55 Independence Ln
- 100 Independence Ln
- 356 Stage Harbor Rd
- 18 Harris Way
- 112 Independence Ln
- 397 Stage Harbor Rd
- 62 Independence Ln