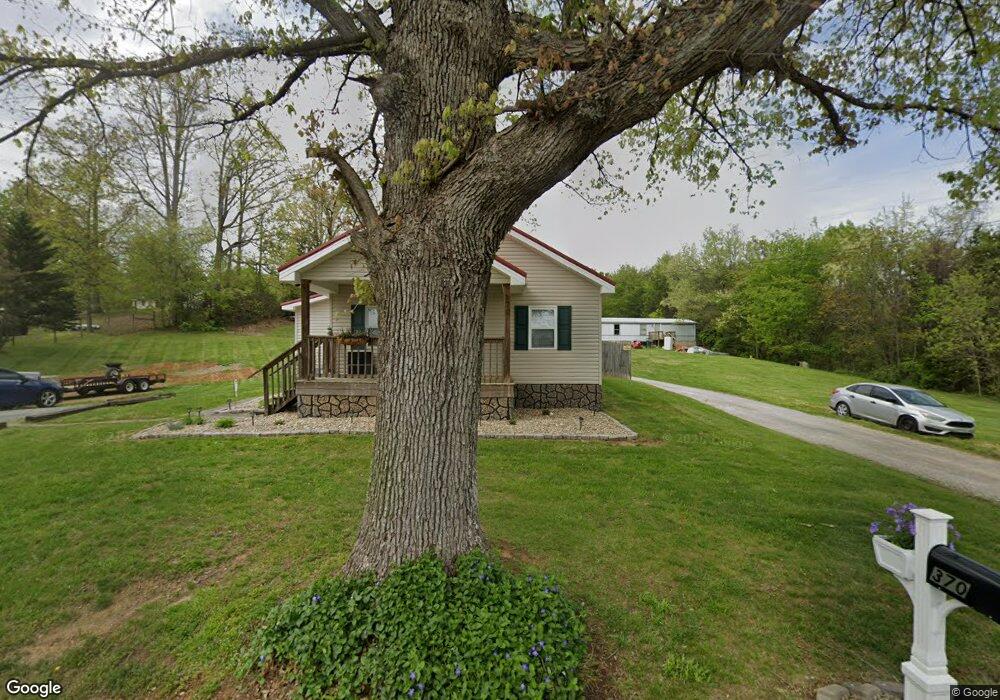
370 Statem Gap Rd Morristown, TN 37813
Estimated Value: $158,011 - $224,000
3
Beds
1
Bath
916
Sq Ft
$203/Sq Ft
Est. Value
About This Home
This home is located at 370 Statem Gap Rd, Morristown, TN 37813 and is currently estimated at $185,503, approximately $202 per square foot. 370 Statem Gap Rd is a home located in Hamblen County with nearby schools including Witt Elementary School, Lincoln Heights Middle School, and Morristown West High School.
Ownership History
Date
Name
Owned For
Owner Type
Purchase Details
Closed on
Mar 19, 2024
Sold by
Kimmell John E and Kimmell Sylvia R
Bought by
Kimmell Dillen Ray and Mcmahan Katelyn Rose
Current Estimated Value
Home Financials for this Owner
Home Financials are based on the most recent Mortgage that was taken out on this home.
Original Mortgage
$115,000
Outstanding Balance
$112,867
Interest Rate
6.64%
Mortgage Type
New Conventional
Estimated Equity
$72,636
Purchase Details
Closed on
May 15, 1998
Sold by
Robertson Edgar and Robertson Faye B
Bought by
Kimmell John
Purchase Details
Closed on
May 26, 1994
Bought by
Sawyer Robert Harold and Lawson Patricia K
Purchase Details
Closed on
Aug 7, 1990
Bought by
Potter William and Potter Wanda
Purchase Details
Closed on
May 6, 1988
Bought by
Potter William
Purchase Details
Closed on
Jun 28, 1947
Bought by
Potter Clara
Purchase Details
Closed on
Jan 1, 1947
Create a Home Valuation Report for This Property
The Home Valuation Report is an in-depth analysis detailing your home's value as well as a comparison with similar homes in the area
Home Values in the Area
Average Home Value in this Area
Purchase History
| Date | Buyer | Sale Price | Title Company |
|---|---|---|---|
| Kimmell Dillen Ray | $125,000 | None Listed On Document | |
| Kimmell Dillen Ray | $125,000 | None Listed On Document | |
| Kimmell John | $21,000 | -- | |
| Sawyer Robert Harold | $69,900 | -- | |
| Potter William | -- | -- | |
| Potter William | -- | -- | |
| Potter Clara | -- | -- | |
| -- | -- | -- |
Source: Public Records
Mortgage History
| Date | Status | Borrower | Loan Amount |
|---|---|---|---|
| Open | Kimmell Dillen Ray | $115,000 | |
| Closed | Kimmell Dillen Ray | $115,000 |
Source: Public Records
Tax History
| Year | Tax Paid | Tax Assessment Tax Assessment Total Assessment is a certain percentage of the fair market value that is determined by local assessors to be the total taxable value of land and additions on the property. | Land | Improvement |
|---|---|---|---|---|
| 2025 | $502 | $34,125 | $3,050 | $31,075 |
| 2024 | $307 | $15,575 | $1,575 | $14,000 |
| 2023 | $307 | $15,575 | $0 | $0 |
| 2022 | $307 | $15,575 | $1,575 | $14,000 |
| 2021 | $307 | $15,575 | $1,575 | $14,000 |
| 2020 | $307 | $15,575 | $1,575 | $14,000 |
| 2019 | $309 | $14,525 | $1,575 | $12,950 |
| 2018 | $309 | $14,525 | $1,575 | $12,950 |
| 2017 | $309 | $14,525 | $1,575 | $12,950 |
| 2016 | $286 | $14,350 | $1,575 | $12,775 |
| 2015 | $265 | $14,350 | $1,575 | $12,775 |
| 2014 | -- | $14,350 | $1,575 | $12,775 |
| 2013 | -- | $16,175 | $0 | $0 |
Source: Public Records
Map
Nearby Homes
- 453 Statem Gap Rd
- 1160 Statem Gap Rd
- 701 Old Witt Rd
- 2540 Castain Dr
- 3440 Sulphur Springs Rd
- 1500 S Davy Crockett Pkwy
- 3023 S Davy Crockett Pkwy
- 1951 Sykes Rd
- 2851 Coffey Rd
- 271 Sequoyah Dr
- 2895 Coffey Rd
- 203 Lincoln Ave
- 715 Lincoln Ave
- 3360 Fernwood Rd
- 2915 Enka Hwy
- 1100 Valley Home Rd
- 507 W Charles St
- 108 Annie Ln
- 109 Annie Ln
- 2945 Enka Hwy
- 444 Statem Gap Rd
- 449 Statem Gap Rd
- 403 Statem Gap Rd
- 350 Statem Gap Rd
- 500 Statem Gap Rd
- 393 Statem Gap Rd
- 321 Statem Gap Rd
- 232 Statem Gap Rd
- 502 Statem Gap Rd
- 455 Statem Gap Rd
- 2660 Lakins Dr
- 554 Statem Gap Rd
- 459 Statem Gap Rd
- 2730 Lakins Dr
- 214 Statem Gap Rd
- 2770 Lakins Dr
- 200 Statem Gap Rd
- 2630 Lakins Dr
- 2798 Lakins Dr
- 2830 Lakins Dr
Your Personal Tour Guide
Ask me questions while you tour the home.