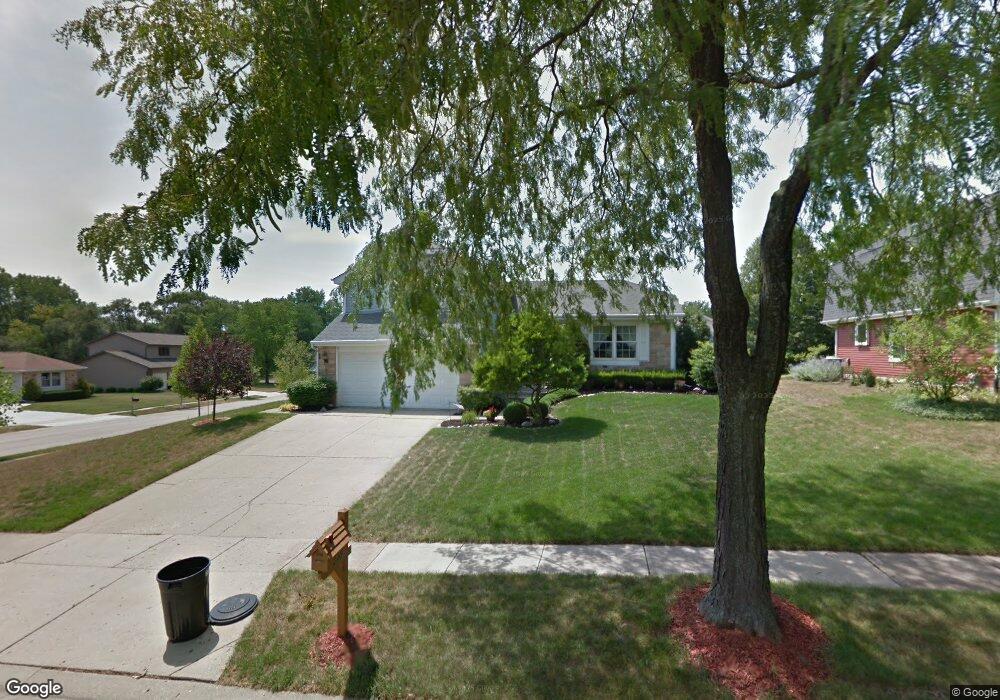
370 Stoney Brook Ct Algonquin, IL 60102
High Hill Farms NeighborhoodEstimated Value: $345,878 - $404,000
Studio
1
Bath
1,420
Sq Ft
$266/Sq Ft
Est. Value
About This Home
This home is located at 370 Stoney Brook Ct, Algonquin, IL 60102 and is currently estimated at $378,220, approximately $266 per square foot. 370 Stoney Brook Ct is a home located in McHenry County with nearby schools including Westfield Community School, Kenneth E Neubert Elementary School, and Harry D Jacobs High School.
Ownership History
Date
Name
Owned For
Owner Type
Purchase Details
Closed on
Mar 7, 2023
Sold by
Scheppman Kyle and Scheppman Lindsey
Bought by
Scheppman Kyle
Current Estimated Value
Purchase Details
Closed on
Jun 22, 2018
Sold by
Merow Donald P and Merow Deborah L
Bought by
Scheppman Kyle and Scheppman Lindsey
Home Financials for this Owner
Home Financials are based on the most recent Mortgage that was taken out on this home.
Original Mortgage
$237,500
Interest Rate
4.6%
Mortgage Type
New Conventional
Purchase Details
Closed on
Feb 28, 1996
Sold by
Suma E Mark and Suma Lisa M
Bought by
Merow Donald P and Merow Deborah L
Home Financials for this Owner
Home Financials are based on the most recent Mortgage that was taken out on this home.
Original Mortgage
$126,900
Interest Rate
7.07%
Purchase Details
Closed on
Jan 4, 1994
Sold by
Suma E Mark and Suma Lisa M
Bought by
Suma E Mark and Suma Lisa M
Create a Home Valuation Report for This Property
The Home Valuation Report is an in-depth analysis detailing your home's value as well as a comparison with similar homes in the area
Home Values in the Area
Average Home Value in this Area
Purchase History
| Date | Buyer | Sale Price | Title Company |
|---|---|---|---|
| Scheppman Kyle | -- | None Listed On Document | |
| Scheppman Kyle | $250,000 | Precision Title | |
| Merow Donald P | $159,000 | -- | |
| Suma E Mark | -- | -- |
Source: Public Records
Mortgage History
| Date | Status | Borrower | Loan Amount |
|---|---|---|---|
| Previous Owner | Scheppman Kyle | $237,500 | |
| Previous Owner | Merow Donald P | $126,900 |
Source: Public Records
Tax History
| Year | Tax Paid | Tax Assessment Tax Assessment Total Assessment is a certain percentage of the fair market value that is determined by local assessors to be the total taxable value of land and additions on the property. | Land | Improvement |
|---|---|---|---|---|
| 2024 | $7,863 | $108,521 | $23,902 | $84,619 |
| 2023 | $7,455 | $97,058 | $21,377 | $75,681 |
| 2022 | $6,541 | $82,276 | $21,044 | $61,232 |
| 2021 | $6,269 | $76,650 | $19,605 | $57,045 |
| 2020 | $6,100 | $73,937 | $18,911 | $55,026 |
| 2019 | $5,947 | $70,767 | $18,100 | $52,667 |
| 2018 | $5,659 | $65,374 | $16,721 | $48,653 |
| 2017 | $5,535 | $61,586 | $15,752 | $45,834 |
| 2016 | $5,443 | $57,762 | $14,774 | $42,988 |
| 2013 | -- | $58,032 | $13,783 | $44,249 |
Source: Public Records
Map
Nearby Homes
- 13 Brian Ct
- 1431 Essex St
- 909 Roger St
- 730 Chestnut Ct
- 700 Fairfield Ln
- LOT 3 Blackhawk Dr
- 135 Arquilla Dr
- 298 Apache Trail
- 615 Harper Dr
- 338 Hiawatha Dr
- 1920 Jester Ln
- 935 Viewpoint Dr
- 7 Falcon Ridge Ct
- 966 Mesa Dr
- 1820 Crofton Dr
- 900 Windstone Ct
- 939 Mesa Dr
- 145 S Oakleaf Rd
- 741 Regal Ln
- 681 Majestic Dr
- 360 Stoney Brook Ct
- 385 Grandview Ct
- 375 Grandview Ct
- 1281 Parkwood Cir
- 1271 Parkwood Cir
- 350 Stoney Brook Ct
- 365 Stoney Brook Ct
- 365 Grandview Ct
- 1291 Parkwood Cir
- 355 Stoney Brook Ct
- 375 Stoney Brook Ct
- 1261 Parkwood Cir
- 340 Stoney Brook Ct
- 345 Stoney Brook Ct
- 355 Grandview Ct
- 342 Country Ln
- 380 Grandview Ct
- 332 Country Ln
- 370 Grandview Ct
- 335 Stoney Brook Ct
Your Personal Tour Guide
Ask me questions while you tour the home.