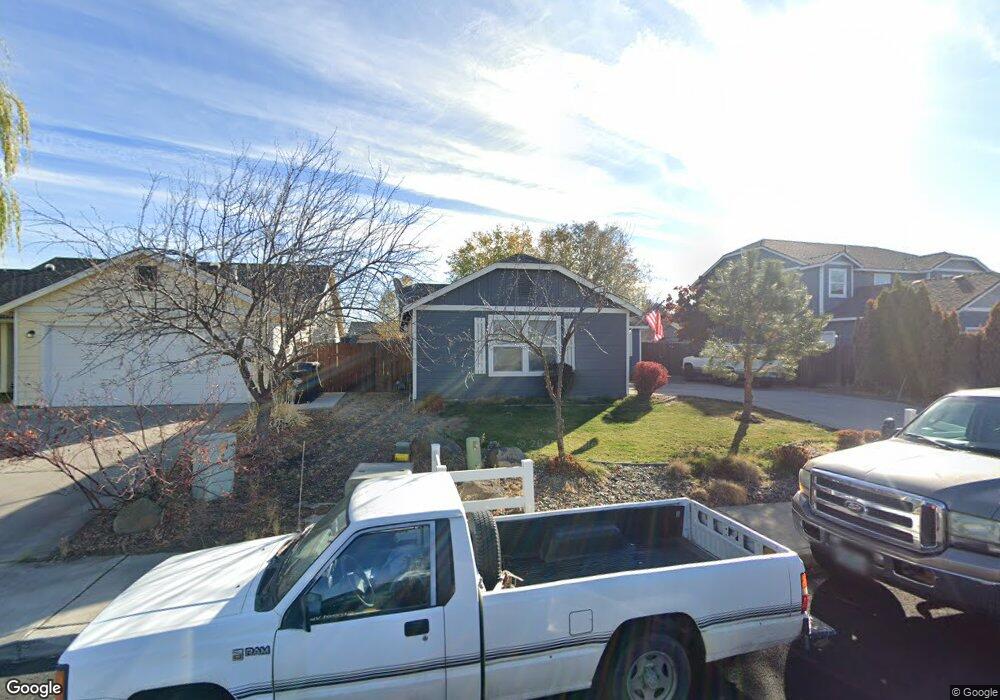
370 SW 33rd Dr Unit HS-54 Redmond, OR 97756
Estimated Value: $402,352 - $427,000
3
Beds
2
Baths
1,031
Sq Ft
$398/Sq Ft
Est. Value
About This Home
This home is located at 370 SW 33rd Dr Unit HS-54, Redmond, OR 97756 and is currently estimated at $410,088, approximately $397 per square foot. 370 SW 33rd Dr Unit HS-54 is a home located in Deschutes County with nearby schools including M.A. Lynch Elementary School, Elton Gregory Middle School, and Redmond High School.
Ownership History
Date
Name
Owned For
Owner Type
Purchase Details
Closed on
Jun 5, 2019
Sold by
Hammack Christina Jo
Bought by
Mckey Donald
Current Estimated Value
Home Financials for this Owner
Home Financials are based on the most recent Mortgage that was taken out on this home.
Original Mortgage
$201,000
Outstanding Balance
$176,355
Interest Rate
4.2%
Mortgage Type
New Conventional
Estimated Equity
$233,733
Purchase Details
Closed on
Mar 25, 2014
Sold by
Granick Travis James and Garnick Katherine Nanette
Bought by
Hammack Christina Jo
Purchase Details
Closed on
Jul 22, 2013
Sold by
Garnick Katherine N and Garnick Travis J
Bought by
Garnick Travis James and Garnick Katherine Nanette
Purchase Details
Closed on
Apr 3, 2012
Sold by
Garnick Katherine N
Bought by
Garnick Travis J and Garnick Katherine N
Purchase Details
Closed on
Apr 20, 2009
Sold by
Hayden Homes Llc
Bought by
Hammack Alice L and Garnick Katherine N
Create a Home Valuation Report for This Property
The Home Valuation Report is an in-depth analysis detailing your home's value as well as a comparison with similar homes in the area
Home Values in the Area
Average Home Value in this Area
Purchase History
| Date | Buyer | Sale Price | Title Company |
|---|---|---|---|
| Mckey Donald | $240,720 | First American Title | |
| Hammack Christina Jo | $5,332 | None Available | |
| Garnick Travis James | -- | None Available | |
| Garnick Travis J | -- | None Available | |
| Hammack Alice L | $132,990 | First American Title |
Source: Public Records
Mortgage History
| Date | Status | Borrower | Loan Amount |
|---|---|---|---|
| Open | Mckey Donald | $201,000 |
Source: Public Records
Tax History Compared to Growth
Tax History
| Year | Tax Paid | Tax Assessment Tax Assessment Total Assessment is a certain percentage of the fair market value that is determined by local assessors to be the total taxable value of land and additions on the property. | Land | Improvement |
|---|---|---|---|---|
| 2025 | $2,754 | $135,050 | -- | -- |
| 2024 | $2,642 | $131,120 | -- | -- |
| 2023 | $2,527 | $127,310 | $0 | $0 |
| 2022 | $2,297 | $120,010 | $0 | $0 |
| 2021 | $2,221 | $116,520 | $0 | $0 |
| 2020 | $2,121 | $116,520 | $0 | $0 |
| 2019 | $2,028 | $113,130 | $0 | $0 |
| 2018 | $1,978 | $109,840 | $0 | $0 |
| 2017 | $1,931 | $106,650 | $0 | $0 |
| 2016 | $1,904 | $103,550 | $0 | $0 |
| 2015 | $1,846 | $100,540 | $0 | $0 |
| 2014 | $1,798 | $97,620 | $0 | $0 |
Source: Public Records
Map
Nearby Homes
- 3325 SW Antler Ridge Ln
- 3149 SW Antler Ln
- 664 SW 35th St
- 3467 W Antler Ave
- 3277 W Antler Ave
- 150 SW 30th St
- 248 SW 29th St
- 3131 SW Highland Ave
- 3154 NW Cedar Ave
- 3331 SW Juniper Ave
- 306 NW 29th St
- 2651 SW Glacier Ave
- 2549 SW Fissure Loop
- 489 NW 29th St
- 2834 SW Indian Place
- 2822 NW Elm Ave
- 1155 SW 31st St
- 1201 SW 28th St Unit 27
- 1201 SW 28th St Unit 48
- 1201 SW 28th St Unit 24
- 370 SW 33rd Dr
- 360 SW 33rd Dr Unit HS-53
- 380 SW 33rd Dr
- 3273 SW Evergreen Ave
- 350 SW 33rd Dr
- 350 SW 33rd Dr Unit HS-52
- 437 SW 32nd St Unit HS155
- 437 SW 32nd St
- 379 SW 33rd Dr
- 369 SW 33rd Dr Unit HS 55
- 417 SW 32nd St Unit HS154
- 417 SW 32nd St
- 14444 NE Oneil Hwy
- 3243 SW Evergreen Ave Unit HS176
- 3306 SW Evergreen Ave
- 340 SW 33rd Dr
- 340 SW 33rd Dr Unit HS-51