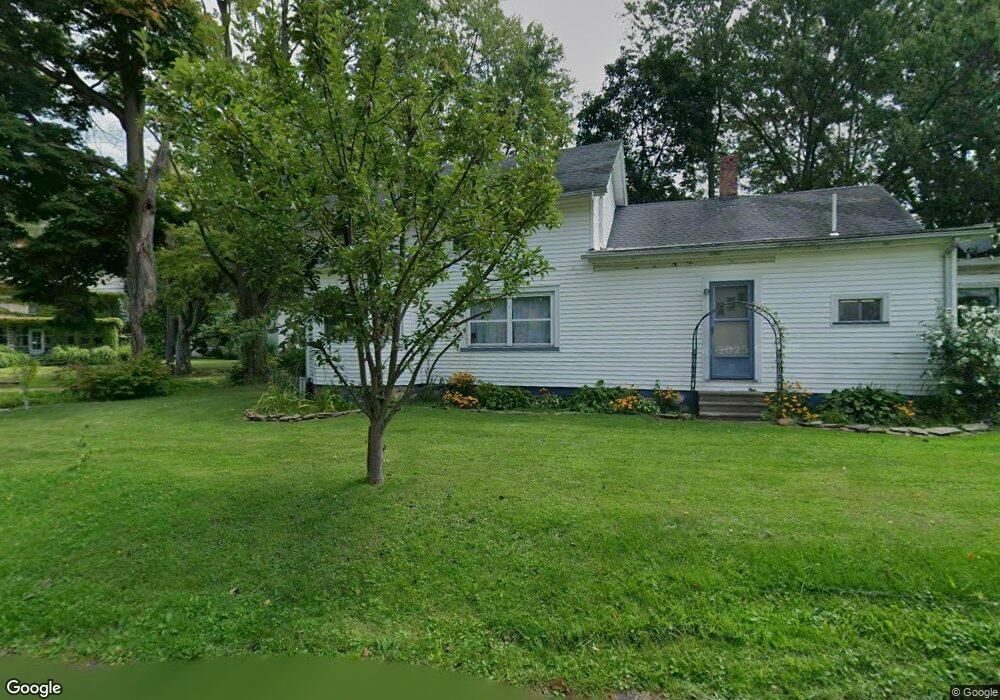
370 Tyler Ave Conneaut, OH 44030
Estimated Value: $104,000 - $166,000
3
Beds
1
Bath
1,427
Sq Ft
$88/Sq Ft
Est. Value
About This Home
This home is located at 370 Tyler Ave, Conneaut, OH 44030 and is currently estimated at $124,869, approximately $87 per square foot. 370 Tyler Ave is a home located in Ashtabula County with nearby schools including Lakeshore Primary Elementary School, Gateway Elementary School, and Conneaut Middle School.
Ownership History
Date
Name
Owned For
Owner Type
Purchase Details
Closed on
Feb 3, 2015
Sold by
Mcguinness James and Mcguinness Jean
Bought by
Applied Technology Group Llc
Current Estimated Value
Purchase Details
Closed on
Mar 10, 2011
Sold by
Kizina Kathryn F
Bought by
Mcguinness James
Purchase Details
Closed on
Jul 28, 2003
Sold by
Local All Cash Homebuyers Ltd
Bought by
Kizina Kathryn F
Home Financials for this Owner
Home Financials are based on the most recent Mortgage that was taken out on this home.
Original Mortgage
$48,900
Interest Rate
5.3%
Mortgage Type
Unknown
Purchase Details
Closed on
Nov 19, 2002
Sold by
Nations Credit Home Equi
Bought by
L A C H B Trst
Purchase Details
Closed on
Oct 31, 2001
Sold by
Petro Marguerite
Bought by
Nations Credit Home Equity
Create a Home Valuation Report for This Property
The Home Valuation Report is an in-depth analysis detailing your home's value as well as a comparison with similar homes in the area
Home Values in the Area
Average Home Value in this Area
Purchase History
| Date | Buyer | Sale Price | Title Company |
|---|---|---|---|
| Applied Technology Group Llc | -- | Chicago Title Agency | |
| Mcguinness James | $41,000 | Venture Title | |
| Kizina Kathryn F | $64,900 | Standard Title Agency Inc | |
| L A C H B Trst | $24,000 | -- | |
| Nations Credit Home Equity | $32,000 | -- |
Source: Public Records
Mortgage History
| Date | Status | Borrower | Loan Amount |
|---|---|---|---|
| Previous Owner | Kizina Kathryn F | $48,900 |
Source: Public Records
Tax History Compared to Growth
Tax History
| Year | Tax Paid | Tax Assessment Tax Assessment Total Assessment is a certain percentage of the fair market value that is determined by local assessors to be the total taxable value of land and additions on the property. | Land | Improvement |
|---|---|---|---|---|
| 2024 | $1,690 | $23,100 | $5,250 | $17,850 |
| 2023 | $1,096 | $23,100 | $5,250 | $17,850 |
| 2022 | $989 | $18,340 | $4,060 | $14,280 |
| 2021 | $1,006 | $18,340 | $4,060 | $14,280 |
| 2020 | $1,005 | $18,340 | $4,060 | $14,280 |
| 2019 | $1,091 | $19,570 | $4,060 | $15,510 |
| 2018 | $1,042 | $19,570 | $4,060 | $15,510 |
| 2017 | $1,040 | $19,570 | $4,060 | $15,510 |
| 2016 | $836 | $17,120 | $3,570 | $13,550 |
| 2015 | $845 | $17,120 | $3,570 | $13,550 |
| 2014 | $748 | $17,120 | $3,570 | $13,550 |
| 2013 | $899 | $21,180 | $3,360 | $17,820 |
Source: Public Records
Map
Nearby Homes