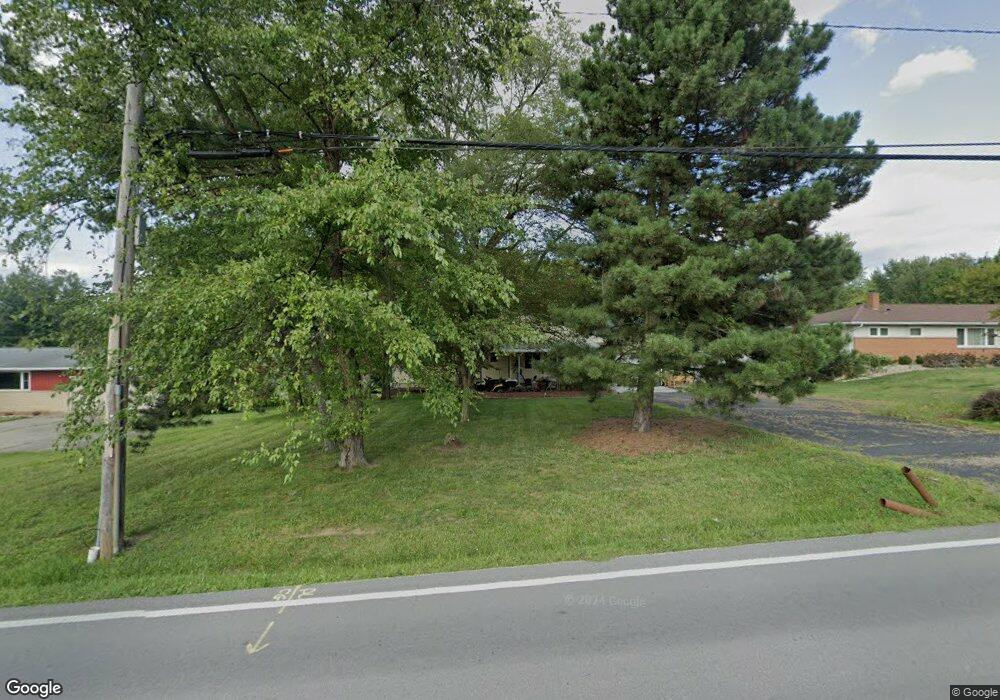
370 W Columbus St Lithopolis, OH 43136
Bloom NeighborhoodEstimated Value: $266,000 - $398,000
3
Beds
3
Baths
1,104
Sq Ft
$295/Sq Ft
Est. Value
About This Home
This home is located at 370 W Columbus St, Lithopolis, OH 43136 and is currently estimated at $325,687, approximately $295 per square foot. 370 W Columbus St is a home located in Fairfield County with nearby schools including Bloom Carroll Primary School, Bloom Carroll Intermediate School, and Bloom-Carroll Middle School.
Ownership History
Date
Name
Owned For
Owner Type
Purchase Details
Closed on
Nov 4, 2020
Sold by
Stalder Karen A
Bought by
Noponen Christopher S and The Stalder Preservation Trust
Current Estimated Value
Purchase Details
Closed on
May 6, 2020
Sold by
Noponen Christopher S
Bought by
Stalder Karen A
Purchase Details
Closed on
Jan 29, 2019
Sold by
Stalder Karen A and Noponen Karen A
Bought by
Goodwin Mary Ann and The Stalder Preservation Trust
Purchase Details
Closed on
Sep 20, 1994
Sold by
Meloy Millard
Bought by
Stalder James R
Home Financials for this Owner
Home Financials are based on the most recent Mortgage that was taken out on this home.
Original Mortgage
$68,000
Interest Rate
8.44%
Mortgage Type
New Conventional
Create a Home Valuation Report for This Property
The Home Valuation Report is an in-depth analysis detailing your home's value as well as a comparison with similar homes in the area
Home Values in the Area
Average Home Value in this Area
Purchase History
| Date | Buyer | Sale Price | Title Company |
|---|---|---|---|
| Noponen Christopher S | -- | None Available | |
| Stalder Karen A | -- | None Available | |
| Noponen Christopher S | -- | None Available | |
| Goodwin Mary Ann | -- | None Available | |
| Stalder James R | $85,000 | -- |
Source: Public Records
Mortgage History
| Date | Status | Borrower | Loan Amount |
|---|---|---|---|
| Previous Owner | Stalder James R | $68,000 |
Source: Public Records
Tax History Compared to Growth
Tax History
| Year | Tax Paid | Tax Assessment Tax Assessment Total Assessment is a certain percentage of the fair market value that is determined by local assessors to be the total taxable value of land and additions on the property. | Land | Improvement |
|---|---|---|---|---|
| 2024 | $5,581 | $70,290 | $20,490 | $49,800 |
| 2023 | $2,949 | $70,290 | $20,490 | $49,800 |
| 2022 | $2,972 | $70,290 | $20,490 | $49,800 |
| 2021 | $2,255 | $48,460 | $17,010 | $31,450 |
| 2020 | $2,254 | $48,460 | $17,010 | $31,450 |
| 2019 | $2,236 | $48,460 | $17,010 | $31,450 |
| 2018 | $1,959 | $39,610 | $17,010 | $22,600 |
| 2017 | $1,841 | $43,280 | $17,010 | $26,270 |
| 2016 | $1,811 | $43,280 | $17,010 | $26,270 |
| 2015 | $1,810 | $42,110 | $17,010 | $25,100 |
| 2014 | $1,748 | $42,110 | $17,010 | $25,100 |
| 2013 | $1,748 | $42,110 | $17,010 | $25,100 |
Source: Public Records
Map
Nearby Homes
- 330 W Columbus St
- 11511 Lithopolis Rd NW
- Harmony Plan at The Summit at Wagnalls Run
- Henley Plan at The Summit at Wagnalls Run
- Bellamy Plan at The Summit at Wagnalls Run
- Stamford Plan at The Summit at Wagnalls Run
- Aldridge Plan at The Summit at Wagnalls Run
- Fairton Plan at The Summit at Wagnalls Run
- Juniper Plan at The Summit at Wagnalls Run
- Chatham Plan at The Summit at Wagnalls Run
- Pendleton Plan at The Summit at Wagnalls Run
- 1400 Hansberry Dr
- 1410 Hansberry Dr
- 557 Eastman Ave
- 199 Wheatley St
- 750 Faulkner Dr
- 0 Columbus St Unit 225023784
- 740 Faulkner Dr
- 607 Eastman Ave
- 720 Faulkner Dr
- 360 W Columbus St
- 380 W Columbus St
- 350 W Columbus St
- 387 Madolin Dr
- 399 Madolin Dr
- 381 Madolin Dr
- 340 W Columbus St
- 363 Madolin Dr
- 351 Madolin Dr
- 343 Madolin Dr
- 430 Madolin Dr
- 410 W Columbus St
- 0 Business Opportunity Unit 223010215
- 400 Madolin Dr
- 11565 Lithopolis Rd NW
- 320 W Columbus St
- 390 Madolin Dr
- 420 W Columbus St
- 380 Madolin Dr
- 75 Wagnalls Dr