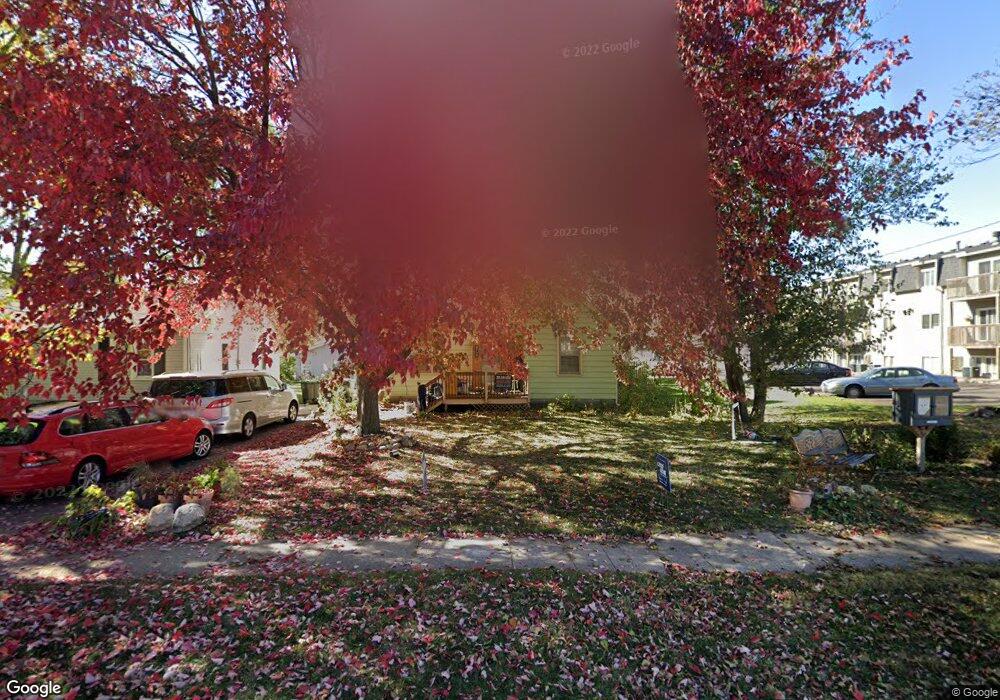
3700 56th St Des Moines, IA 50310
Merle Hay NeighborhoodEstimated Value: $204,000 - $244,000
3
Beds
1
Bath
1,118
Sq Ft
$200/Sq Ft
Est. Value
About This Home
This home is located at 3700 56th St, Des Moines, IA 50310 and is currently estimated at $224,014, approximately $200 per square foot. 3700 56th St is a home located in Polk County with nearby schools including Moore Elementary School, Meredith Middle School, and Hoover High School.
Ownership History
Date
Name
Owned For
Owner Type
Purchase Details
Closed on
Mar 27, 2009
Sold by
National City Home Loan Services
Bought by
Aschim Thorstein B
Current Estimated Value
Home Financials for this Owner
Home Financials are based on the most recent Mortgage that was taken out on this home.
Original Mortgage
$7,730
Outstanding Balance
$4,915
Interest Rate
5.05%
Mortgage Type
Stand Alone Second
Estimated Equity
$219,099
Purchase Details
Closed on
Feb 12, 2009
Sold by
Catron Mary
Bought by
National City Home Loan Services
Home Financials for this Owner
Home Financials are based on the most recent Mortgage that was taken out on this home.
Original Mortgage
$81,178
Outstanding Balance
$51,782
Interest Rate
5.19%
Mortgage Type
Stand Alone First
Estimated Equity
$172,232
Purchase Details
Closed on
Dec 21, 2000
Sold by
Lamb Lucy B
Bought by
Catron John and Catron Mary
Home Financials for this Owner
Home Financials are based on the most recent Mortgage that was taken out on this home.
Original Mortgage
$76,000
Interest Rate
9.62%
Create a Home Valuation Report for This Property
The Home Valuation Report is an in-depth analysis detailing your home's value as well as a comparison with similar homes in the area
Home Values in the Area
Average Home Value in this Area
Purchase History
| Date | Buyer | Sale Price | Title Company |
|---|---|---|---|
| Aschim Thorstein B | $85,000 | None Available | |
| National City Home Loan Services | $78,750 | None Available | |
| Catron John | $94,500 | -- |
Source: Public Records
Mortgage History
| Date | Status | Borrower | Loan Amount |
|---|---|---|---|
| Open | Aschim Thorstein B | $7,730 | |
| Open | Aschim Thorstein B | $81,178 | |
| Previous Owner | Catron John | $76,000 | |
| Closed | Catron John | $19,000 |
Source: Public Records
Tax History Compared to Growth
Tax History
| Year | Tax Paid | Tax Assessment Tax Assessment Total Assessment is a certain percentage of the fair market value that is determined by local assessors to be the total taxable value of land and additions on the property. | Land | Improvement |
|---|---|---|---|---|
| 2025 | $3,254 | $192,000 | $62,100 | $129,900 |
| 2024 | $3,254 | $175,900 | $56,100 | $119,800 |
| 2023 | $3,764 | $175,900 | $56,100 | $119,800 |
| 2022 | $3,734 | $168,600 | $48,800 | $119,800 |
| 2021 | $3,638 | $168,600 | $48,800 | $119,800 |
| 2020 | $3,774 | $154,400 | $44,500 | $109,900 |
| 2019 | $3,504 | $154,400 | $44,500 | $109,900 |
| 2018 | $3,464 | $138,900 | $39,200 | $99,700 |
| 2017 | $3,166 | $138,900 | $39,200 | $99,700 |
| 2016 | $3,080 | $125,600 | $35,000 | $90,600 |
| 2015 | $3,080 | $125,600 | $35,000 | $90,600 |
| 2014 | $3,024 | $127,000 | $34,700 | $92,300 |
Source: Public Records
Map
Nearby Homes