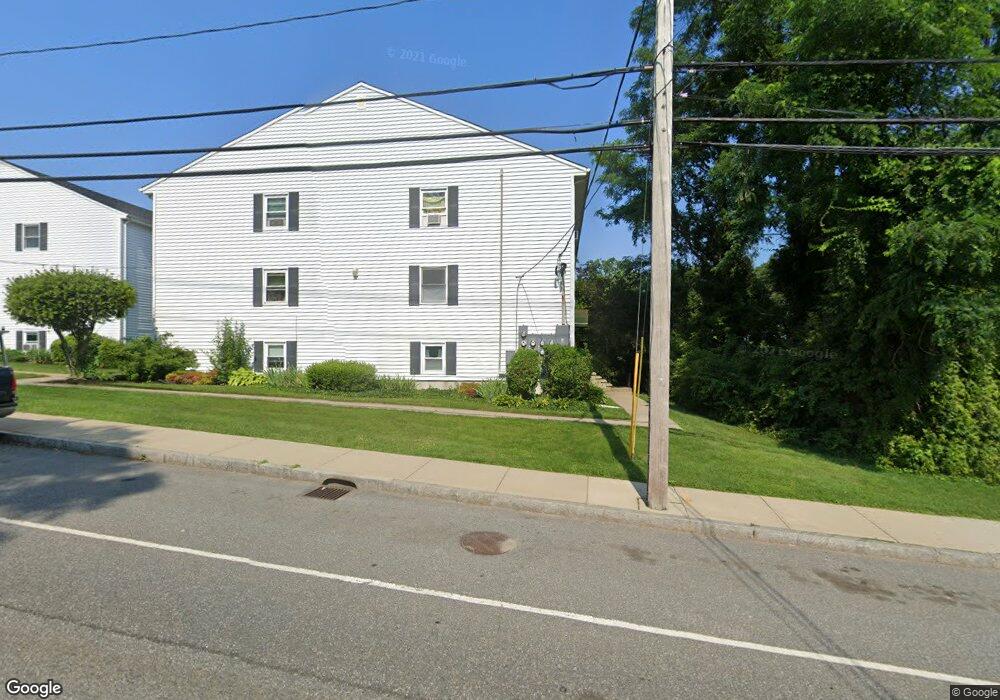
3700 N Main St Unit 6 Fall River, MA 02720
Western Fall River NeighborhoodEstimated Value: $206,000 - $239,000
2
Beds
1
Bath
750
Sq Ft
$302/Sq Ft
Est. Value
About This Home
This home is located at 3700 N Main St Unit 6, Fall River, MA 02720 and is currently estimated at $226,871, approximately $302 per square foot. 3700 N Main St Unit 6 is a home located in Bristol County with nearby schools including North End Elementary School, Morton Middle School, and B M C Durfee High School.
Ownership History
Date
Name
Owned For
Owner Type
Purchase Details
Closed on
Dec 8, 2021
Sold by
Borges Shryle
Bought by
Borges-Morais Shryle and Morais Nicholas
Current Estimated Value
Home Financials for this Owner
Home Financials are based on the most recent Mortgage that was taken out on this home.
Original Mortgage
$54,150
Interest Rate
3.22%
Mortgage Type
New Conventional
Purchase Details
Closed on
Feb 10, 1994
Sold by
Crossland Fsb
Bought by
Borges Charles and Borges Shryle
Purchase Details
Closed on
Mar 12, 1993
Sold by
Crossland Fsb
Bought by
Borges Charles and Borges Shryle
Purchase Details
Closed on
Jun 18, 1990
Sold by
Owens Jarrett C
Bought by
Metmor Financial Inc
Create a Home Valuation Report for This Property
The Home Valuation Report is an in-depth analysis detailing your home's value as well as a comparison with similar homes in the area
Home Values in the Area
Average Home Value in this Area
Purchase History
We collect this data history from publicly available records. To have your information removed, we recommend requesting removal directly through your county’s website.
| Date | Buyer | Sale Price | Title Company |
|---|---|---|---|
| Borges-Morais Shryle | -- | None Available | |
| Borges-Morais Shryle | -- | None Available | |
| Borges Charles | $25,000 | -- | |
| Borges Charles | $25,000 | -- | |
| Borges Charles | $25,000 | -- | |
| Borges Charles | $25,000 | -- | |
| Metmor Financial Inc | $80,705 | -- |
Source: Public Records
Mortgage History
We collect this data history from publicly available records. To have your information removed, we recommend requesting removal directly through your county’s website.
| Date | Status | Borrower | Loan Amount |
|---|---|---|---|
| Previous Owner | Borges-Morais Shryle | $54,150 | |
| Previous Owner | Metmor Financial Inc | $37,000 | |
| Previous Owner | Metmor Financial Inc | $15,000 |
Source: Public Records
Tax History
| Year | Tax Paid | Tax Assessment Tax Assessment Total Assessment is a certain percentage of the fair market value that is determined by local assessors to be the total taxable value of land and additions on the property. | Land | Improvement |
|---|---|---|---|---|
| 2025 | $1,798 | $157,000 | $0 | $157,000 |
| 2024 | $1,748 | $152,100 | $0 | $152,100 |
| 2023 | $1,486 | $121,100 | $0 | $121,100 |
| 2022 | $1,527 | $121,000 | $0 | $121,000 |
| 2021 | $1,460 | $105,600 | $0 | $105,600 |
| 2020 | $1,155 | $79,900 | $0 | $79,900 |
| 2019 | $1,123 | $77,000 | $0 | $77,000 |
| 2018 | $1,104 | $75,500 | $0 | $75,500 |
| 2017 | $1,141 | $81,500 | $0 | $81,500 |
| 2016 | $1,079 | $79,200 | $0 | $79,200 |
| 2015 | $1,114 | $85,200 | $0 | $85,200 |
| 2014 | $867 | $68,900 | $0 | $68,900 |
Source: Public Records
Map
Nearby Homes
- 3682 N Main St Unit 6
- 50 Clark St Unit 11
- 120 Lewin St Unit 7
- 4234 N Main St Unit 208
- 2714 Riverside Ave
- 30 Gray St
- 194 Grove Ave
- 341 Courtney St
- 372 Buffinton St
- 4700 N Main St Unit 1
- 1870 County St
- 200: Lot 1 Highcrest Rd
- Lot 2 Highcrest Rd
- 200 Highcrest Rd
- 240 Horizon Way
- 46 Lilac Ave
- 277 Valentine St
- 103 Valentine St Unit 3
- 318 Crescent St Unit A
- 1496 Riverside Ave
- 3700 N Main St Unit 12
- 3700 N Main St Unit 11
- 3700 N Main St Unit 10
- 3700 N Main St Unit 9
- 3700 N Main St Unit 8
- 3700 N Main St Unit 7
- 3700 N Main St Unit 5
- 3700 N Main St Unit 4
- 3700 N Main St Unit 3
- 3700 N Main St Unit 2
- 3700 N Main St Unit 1
- 3682 N Main St Unit 12
- 3682 N Main St Unit 11
- 3682 N Main St Unit 10
- 3682 N Main St Unit 9
- 3682 N Main St Unit 8
- 3682 N Main St Unit 5
- 3682 N Main St Unit 4
- 3682 N Main St Unit 3
- 3682 N Main St Unit 2
Your Personal Tour Guide
Ask me questions while you tour the home.