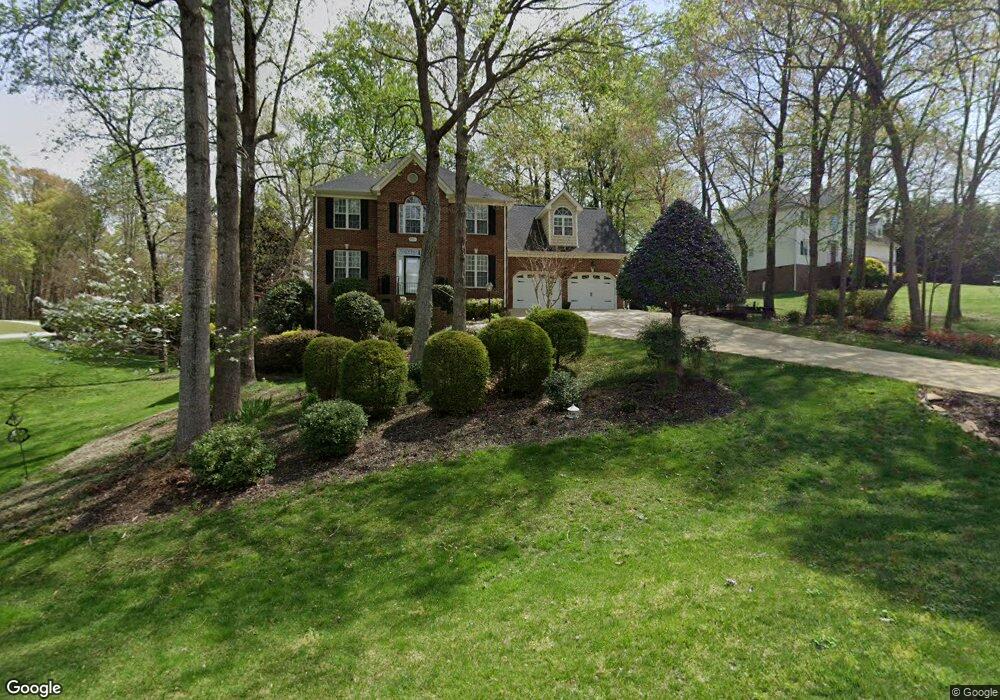
3701 Farmstone Dr Raleigh, NC 27603
Estimated Value: $577,542 - $632,000
3
Beds
3
Baths
2,253
Sq Ft
$266/Sq Ft
Est. Value
About This Home
This home is located at 3701 Farmstone Dr, Raleigh, NC 27603 and is currently estimated at $599,636, approximately $266 per square foot. 3701 Farmstone Dr is a home located in Wake County with nearby schools including Yates Mill Elementary School, Dillard Drive Magnet Middle School, and Middle Creek High.
Ownership History
Date
Name
Owned For
Owner Type
Purchase Details
Closed on
Jul 11, 2024
Sold by
Whitt Larry Rommie and Rahman-Whitt Hafeezah
Bought by
Rahman Whitt Family Trust and Whitt
Current Estimated Value
Purchase Details
Closed on
May 10, 2004
Sold by
Ward John M and Ward Judith Ann
Bought by
Abdul Rahman Hafeezah
Home Financials for this Owner
Home Financials are based on the most recent Mortgage that was taken out on this home.
Original Mortgage
$188,000
Interest Rate
5.49%
Mortgage Type
New Conventional
Purchase Details
Closed on
Feb 24, 1999
Sold by
Allen Thornton Homes Inc
Bought by
Ward John M
Home Financials for this Owner
Home Financials are based on the most recent Mortgage that was taken out on this home.
Original Mortgage
$197,900
Interest Rate
6.84%
Mortgage Type
Balloon
Create a Home Valuation Report for This Property
The Home Valuation Report is an in-depth analysis detailing your home's value as well as a comparison with similar homes in the area
Home Values in the Area
Average Home Value in this Area
Purchase History
| Date | Buyer | Sale Price | Title Company |
|---|---|---|---|
| Rahman Whitt Family Trust | -- | None Listed On Document | |
| Whitt Larry Rommie | -- | None Listed On Document | |
| Abdul Rahman Hafeezah | $238,000 | None Available | |
| Ward John M | $220,000 | -- |
Source: Public Records
Mortgage History
| Date | Status | Borrower | Loan Amount |
|---|---|---|---|
| Previous Owner | Abdul Rahman Hafeezah | $188,000 | |
| Previous Owner | Ward John M | $197,900 |
Source: Public Records
Tax History Compared to Growth
Tax History
| Year | Tax Paid | Tax Assessment Tax Assessment Total Assessment is a certain percentage of the fair market value that is determined by local assessors to be the total taxable value of land and additions on the property. | Land | Improvement |
|---|---|---|---|---|
| 2025 | $3,335 | $518,323 | $140,000 | $378,323 |
| 2024 | $3,239 | $518,323 | $140,000 | $378,323 |
| 2023 | $2,620 | $333,485 | $68,000 | $265,485 |
| 2022 | $2,428 | $333,485 | $68,000 | $265,485 |
| 2021 | $2,363 | $333,485 | $68,000 | $265,485 |
| 2020 | $2,324 | $333,485 | $68,000 | $265,485 |
| 2019 | $2,271 | $275,632 | $68,000 | $207,632 |
| 2018 | $2,088 | $275,632 | $68,000 | $207,632 |
| 2017 | $1,980 | $275,632 | $68,000 | $207,632 |
| 2016 | $1,940 | $275,632 | $68,000 | $207,632 |
| 2015 | $2,019 | $287,766 | $78,000 | $209,766 |
| 2014 | -- | $287,766 | $78,000 | $209,766 |
Source: Public Records
Map
Nearby Homes
- 3613 Cross Timber Ln
- 3716 Cross Timber Ln
- 5702 Volos Ave
- 5300 Trilogy Farm Dr
- 3204 Manor Ridge Dr
- 7612 Fayetteville Rd
- 3901 Bluffwind Dr
- 5009 Megara Run
- 3728 Westbury Lake Dr
- 7625 Fayetteville Rd
- 4104 Cross Timber Ln
- 3740 Westbury Lake Dr
- 246 Broomside Ave
- 7025 Fayetteville Rd
- 529 Prestonfield Way
- 4916 Chase Hill Way
- 4036 Ridgebrook Bluffs Dr
- 716 Ben Ledi Ct
- 416 Grange Farm Place
- 521 Prestonfield Way
- lot 5 Wheelerbrook Ct
- Lot 4 Wheelerbrook Ct
- 3705 Farmstone Dr
- 2001 Wheelerbrook Ct
- 2012 Wheelerbrook Ct
- 3700 Farmstone Dr
- 2016 Wheelerbrook Ct
- 3709 Farmstone Dr
- 3704 Farmstone Dr
- 2004 Wheelerbrook Ct
- 2100 Wheelerbrook Ct
- 2105 Wheelerbrook Ct
- 3708 Farmstone Dr
- 2000 Wheelerbrook Ct
- 3713 Farmstone Dr
- 1913 Wheelerbrook Ct
- 2104 Wheelerbrook Ct
- 1920 Wheelerbrook Ct
- 2109 Wheelerbrook Ct
- 1912 Blue Slate Ct