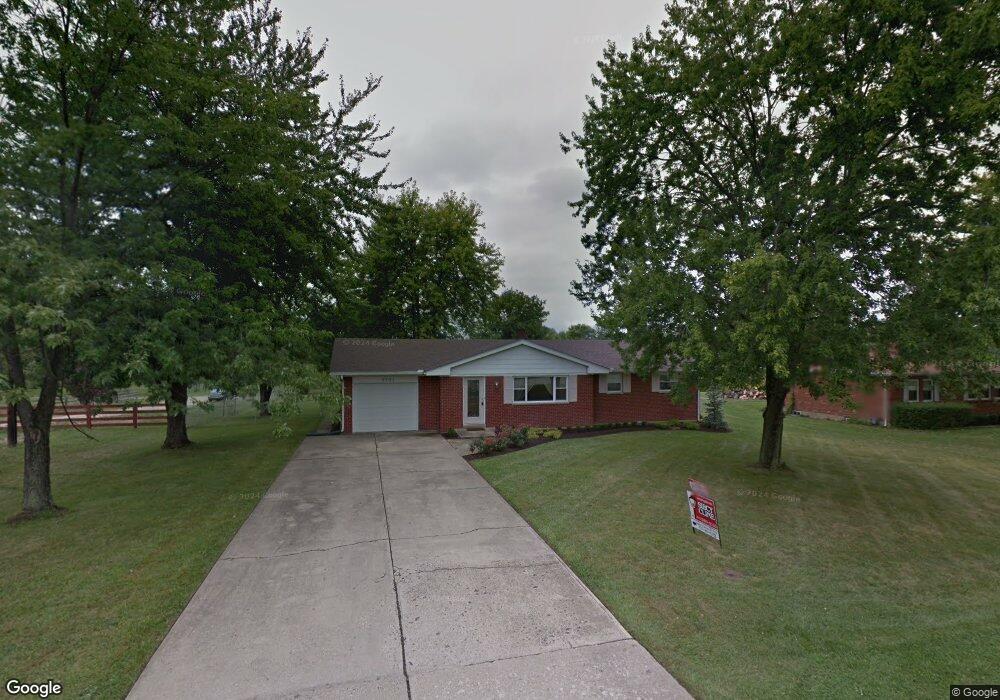
3701 Ruby Dr Franklin, OH 45005
Estimated Value: $229,084 - $293,000
3
Beds
1
Bath
1,173
Sq Ft
$223/Sq Ft
Est. Value
About This Home
This home is located at 3701 Ruby Dr, Franklin, OH 45005 and is currently estimated at $261,521, approximately $222 per square foot. 3701 Ruby Dr is a home located in Warren County with nearby schools including Franklin High School, Summit Academy Community School for Alternative Learners - Middletown, and Marshall High School.
Ownership History
Date
Name
Owned For
Owner Type
Purchase Details
Closed on
Oct 21, 2011
Sold by
Mb Kunkel Investments
Bought by
Hoskins Stefan T and Hoskins Rebecca L
Current Estimated Value
Home Financials for this Owner
Home Financials are based on the most recent Mortgage that was taken out on this home.
Original Mortgage
$95,515
Outstanding Balance
$65,131
Interest Rate
4.4%
Mortgage Type
FHA
Estimated Equity
$196,390
Purchase Details
Closed on
Jan 12, 2011
Sold by
Fannie Mae
Bought by
Mb Kunkel Investments
Purchase Details
Closed on
Jul 19, 2010
Sold by
Reece Phillip M
Bought by
Federal National Mortgage Association
Purchase Details
Closed on
Jul 5, 2006
Sold by
Norris James H and Norris Bernadine
Bought by
Reece Philip M
Home Financials for this Owner
Home Financials are based on the most recent Mortgage that was taken out on this home.
Original Mortgage
$114,000
Interest Rate
6.72%
Mortgage Type
Purchase Money Mortgage
Create a Home Valuation Report for This Property
The Home Valuation Report is an in-depth analysis detailing your home's value as well as a comparison with similar homes in the area
Home Values in the Area
Average Home Value in this Area
Purchase History
| Date | Buyer | Sale Price | Title Company |
|---|---|---|---|
| Hoskins Stefan T | $98,000 | All Points Title | |
| Mb Kunkel Investments | $58,000 | None Available | |
| Federal National Mortgage Association | $102,320 | None Available | |
| Reece Philip M | $114,000 | Lawyers Title Jeff |
Source: Public Records
Mortgage History
| Date | Status | Borrower | Loan Amount |
|---|---|---|---|
| Open | Hoskins Stefan T | $95,515 | |
| Previous Owner | Reece Philip M | $114,000 |
Source: Public Records
Tax History
| Year | Tax Paid | Tax Assessment Tax Assessment Total Assessment is a certain percentage of the fair market value that is determined by local assessors to be the total taxable value of land and additions on the property. | Land | Improvement |
|---|---|---|---|---|
| 2025 | $2,552 | $57,440 | $14,090 | $43,350 |
| 2024 | $2,552 | $57,440 | $14,090 | $43,350 |
| 2023 | $2,299 | $46,585 | $11,553 | $35,031 |
| 2022 | $2,545 | $46,585 | $11,554 | $35,032 |
| 2021 | $2,515 | $46,585 | $11,554 | $35,032 |
| 2020 | $2,360 | $37,874 | $9,394 | $28,480 |
| 2019 | $2,167 | $37,874 | $9,394 | $28,480 |
| 2018 | $2,173 | $37,874 | $9,394 | $28,480 |
| 2017 | $2,061 | $32,386 | $8,152 | $24,234 |
| 2016 | $2,098 | $32,386 | $8,152 | $24,234 |
| 2015 | $2,102 | $32,386 | $8,152 | $24,234 |
| 2014 | $1,648 | $30,840 | $7,760 | $23,080 |
| 2013 | $1,400 | $37,310 | $9,390 | $27,920 |
Source: Public Records
Map
Nearby Homes
- 3635 Julie Dr
- 5019 Betsy Dr
- 3833 Sterling Dr
- 3466 Renaissance Ct
- 5100 Renaissance Park Dr
- 4689 Fisher Rd
- 5139 Renaissance Park Dr
- 5482 Sheldon Close
- 5455 Sheldon Close
- 5200 Long Meadow Dr
- 5371 Sheldon Close
- 5284 Othello Dr
- 5302 Othello Dr
- 3048 Canvasback Ct
- 4385 Harvest Ln
- 4458 Rose Marie Rd
- 4640 Shaker Rd
- 3644 Connie Dr
- 3412 State Route 122
- 4650 Shaker Rd
Your Personal Tour Guide
Ask me questions while you tour the home.