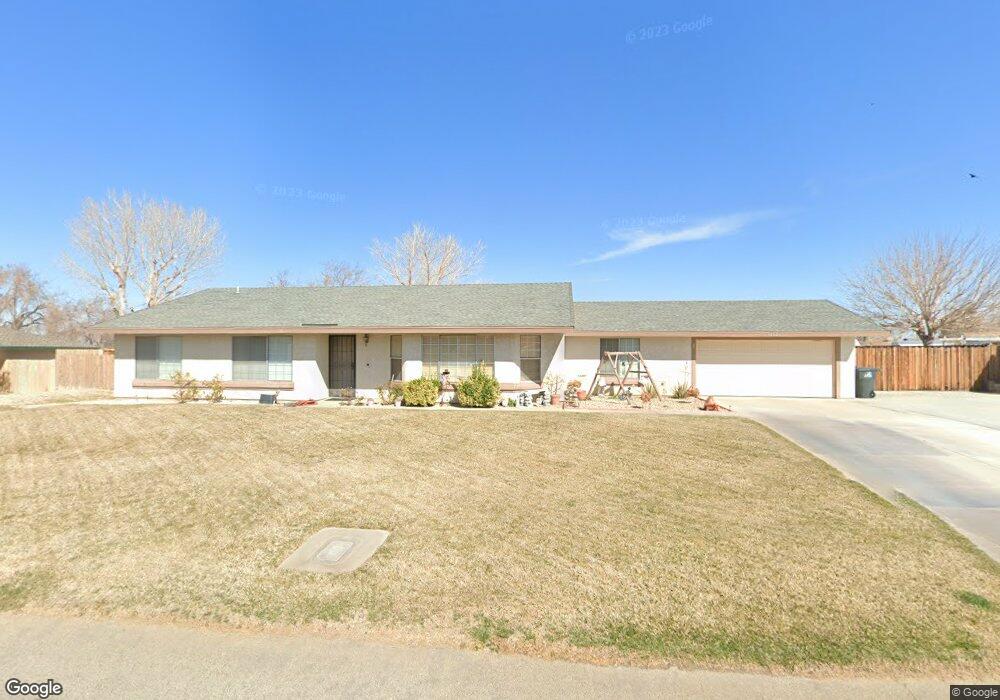
37020 Littlerock Ranchos Rd Littlerock, CA 93543
Estimated Value: $535,365 - $629,000
3
Beds
2
Baths
1,928
Sq Ft
$296/Sq Ft
Est. Value
About This Home
This home is located at 37020 Littlerock Ranchos Rd, Littlerock, CA 93543 and is currently estimated at $570,841, approximately $296 per square foot. 37020 Littlerock Ranchos Rd is a home located in Los Angeles County with nearby schools including Keppel Academy, Alpine Elementary School, and Littlerock High School.
Ownership History
Date
Name
Owned For
Owner Type
Purchase Details
Closed on
Jun 13, 1997
Sold by
Hud
Bought by
Gartrell Steven and Gartrell Vicki
Current Estimated Value
Home Financials for this Owner
Home Financials are based on the most recent Mortgage that was taken out on this home.
Original Mortgage
$105,850
Outstanding Balance
$15,147
Interest Rate
7.98%
Mortgage Type
FHA
Estimated Equity
$555,694
Purchase Details
Closed on
Feb 25, 1997
Sold by
Gmac Mtg Corp
Bought by
Hud
Purchase Details
Closed on
Nov 20, 1996
Sold by
Campbell Johnny B
Bought by
Gmac Mtg Corp Of Pa
Purchase Details
Closed on
Jul 6, 1996
Sold by
Murray Lydia I
Bought by
Felson Richard
Purchase Details
Closed on
May 23, 1996
Sold by
Murray Lydia I
Bought by
Marcos Sidney A
Purchase Details
Closed on
Feb 29, 1996
Sold by
Murray Lydia I
Bought by
Simmons Derek
Create a Home Valuation Report for This Property
The Home Valuation Report is an in-depth analysis detailing your home's value as well as a comparison with similar homes in the area
Home Values in the Area
Average Home Value in this Area
Purchase History
| Date | Buyer | Sale Price | Title Company |
|---|---|---|---|
| Gartrell Steven | $115,500 | Orange Coast Title | |
| Hud | -- | Fidelity National Title Ins | |
| Gmac Mtg Corp Of Pa | $142,725 | Benefit Land Title Ins Co | |
| Felson Richard | -- | -- | |
| Marcos Sidney A | -- | -- | |
| Simmons Derek | -- | -- |
Source: Public Records
Mortgage History
| Date | Status | Borrower | Loan Amount |
|---|---|---|---|
| Open | Gartrell Steven | $105,850 |
Source: Public Records
Tax History Compared to Growth
Tax History
| Year | Tax Paid | Tax Assessment Tax Assessment Total Assessment is a certain percentage of the fair market value that is determined by local assessors to be the total taxable value of land and additions on the property. | Land | Improvement |
|---|---|---|---|---|
| 2025 | $2,074 | $172,610 | $48,844 | $123,766 |
| 2024 | $2,074 | $169,227 | $47,887 | $121,340 |
| 2023 | $2,031 | $165,910 | $46,949 | $118,961 |
| 2022 | $1,996 | $162,658 | $46,029 | $116,629 |
| 2021 | $1,952 | $159,470 | $45,127 | $114,343 |
| 2019 | $1,894 | $154,742 | $43,790 | $110,952 |
| 2018 | $1,878 | $151,709 | $42,932 | $108,777 |
| 2016 | $1,752 | $145,820 | $41,266 | $104,554 |
| 2015 | $1,727 | $143,631 | $40,647 | $102,984 |
| 2014 | $1,730 | $140,818 | $39,851 | $100,967 |
Source: Public Records
Map
Nearby Homes
- 36875 Littlerock Ranchos Rd
- 36916 95th St E
- 136 Th. Str& East Ave S
- 118 East Ave S
- 10516 East Ave S
- 0 Ave R14 Vic 92nd Ste Unit IV24250455
- 0 Ave R14 Vic 92nd Ste Unit 24009183
- 9241 E Avenue r14
- 10 East Ave S
- 0 E Avenue s2
- 9069 E Avenue R 14
- 9069 E Avenue r14
- 90 90th St E & Kanow (Ave S-4)
- 90 Kanow Ave
- 0 Vac Corner Ave S 90th Ste
- 9642 E Avenue R 14
- 9642 E Avenue r14
- 36646 92nd St E
- 96th 116th St E
- 9604 E Avenue r12
- 37034 Littlerock Ranchos Rd
- 37012 Littlerock Ranchos Rd
- 37025 Littlerock Ranchos Rd
- 37015 Littlerock Ranchos Rd
- 37035 Littlerock Ranchos Rd
- 37044 Littlerock Ranchos Rd
- 37045 Littlerock Ranchos Rd
- 36961 Littlerock Ranchos Rd
- 37055 Littlerock Ranchos Rd
- 36949 Littlerock Ranchos Rd
- 0 93rd & Avenue Q St
- 37112 Littlerock Ranchos Rd
- 37105 Littlerock Ranchos Rd
- 36939 Littlerock Ranchos Rd
- 37105 93rd St E
- 37025 94th St E
- 36936 Littlerock Ranchos Rd
- 37113 Littlerock Ranchos Rd
- 37015 94th St E
- 37037 94th St E