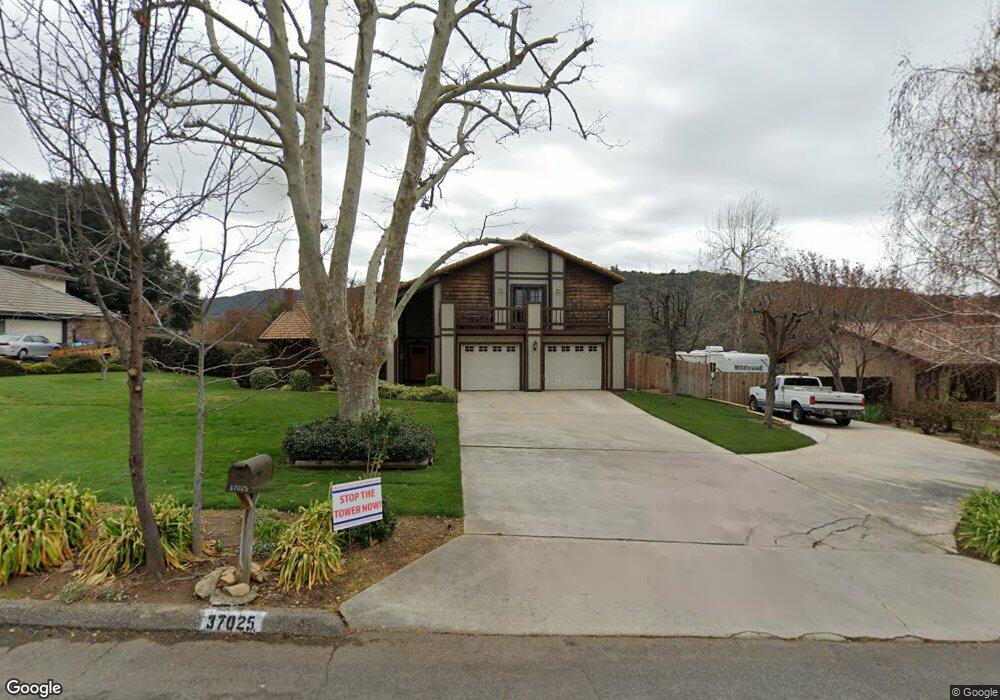
37025 Oak View Rd Yucaipa, CA 92399
Estimated Value: $728,000 - $860,000
3
Beds
3
Baths
2,322
Sq Ft
$343/Sq Ft
Est. Value
About This Home
This home is located at 37025 Oak View Rd, Yucaipa, CA 92399 and is currently estimated at $796,957, approximately $343 per square foot. 37025 Oak View Rd is a home located in San Bernardino County with nearby schools including Wildwood Elementary School, Mesa View Middle School, and Yucaipa High School.
Ownership History
Date
Name
Owned For
Owner Type
Purchase Details
Closed on
Jun 24, 2015
Sold by
Manning Robert Coe
Bought by
The Robert Coe Manning & Lucille Scott M
Current Estimated Value
Purchase Details
Closed on
Aug 25, 1998
Sold by
Glendale Federal Bank Fsb
Bought by
Manning Robert C and Manning Lucille S
Home Financials for this Owner
Home Financials are based on the most recent Mortgage that was taken out on this home.
Original Mortgage
$160,000
Outstanding Balance
$34,237
Interest Rate
6.92%
Estimated Equity
$762,720
Purchase Details
Closed on
May 13, 1998
Sold by
Williams Richard G and Williams Denise D
Bought by
Federal Federal Bank
Purchase Details
Closed on
Sep 9, 1994
Sold by
Williams Richard Glen
Bought by
Williams Richard G and Williams Denise D
Home Financials for this Owner
Home Financials are based on the most recent Mortgage that was taken out on this home.
Original Mortgage
$215,000
Interest Rate
8.37%
Create a Home Valuation Report for This Property
The Home Valuation Report is an in-depth analysis detailing your home's value as well as a comparison with similar homes in the area
Purchase History
| Date | Buyer | Sale Price | Title Company |
|---|---|---|---|
| The Robert Coe Manning & Lucille Scott M | -- | None Available | |
| Manning Robert C | $200,000 | First American Title Ins Co | |
| Federal Federal Bank | $227,911 | American Title Ins Co | |
| Williams Richard G | -- | Commonwealth Land Title |
Source: Public Records
Mortgage History
| Date | Status | Borrower | Loan Amount |
|---|---|---|---|
| Open | Manning Robert C | $160,000 | |
| Previous Owner | Williams Richard G | $215,000 |
Source: Public Records
Tax History
| Year | Tax Paid | Tax Assessment Tax Assessment Total Assessment is a certain percentage of the fair market value that is determined by local assessors to be the total taxable value of land and additions on the property. | Land | Improvement |
|---|---|---|---|---|
| 2025 | $4,004 | $313,542 | $94,063 | $219,479 |
| 2024 | $3,887 | $307,394 | $92,219 | $215,175 |
| 2023 | $3,802 | $301,367 | $90,411 | $210,956 |
| 2022 | $3,737 | $295,458 | $88,638 | $206,820 |
| 2021 | $3,676 | $289,665 | $86,900 | $202,765 |
| 2020 | $3,696 | $286,695 | $86,009 | $200,686 |
| 2019 | $3,575 | $281,074 | $84,323 | $196,751 |
| 2018 | $3,262 | $275,563 | $82,670 | $192,893 |
| 2017 | $3,190 | $270,160 | $81,049 | $189,111 |
| 2016 | $3,146 | $264,863 | $79,460 | $185,403 |
| 2015 | $3,112 | $260,884 | $78,266 | $182,618 |
| 2014 | -- | $255,774 | $76,733 | $179,041 |
Source: Public Records
Map
Nearby Homes
- 37240 Limekiln Dr
- 36698 Parkview Terrace
- 12943 Lupine Ct
- 0 Wildwood View Dr
- 13600 Diamond Point Dr Unit 1
- 36415 Cherrywood Dr
- 37420 Wildwood View Dr
- 36378 Escena Dr
- 13405 Mesa Crest Dr
- 36232 Village Rd
- 13776 Meadow View Ln
- 38808 Finch Dr
- 13574 Pamela Ct
- 13673 Dogwood Trail
- 34529 Wildwood Canyon Rd
- 3411 Wildwood Canyon Rd Unit Space 10
- 35994 Leah Ln
- 35891 Wildwood Crest Dr
- 35892 Wildwood Crest Dr
- 35890 Wildwood Crest Dr
- 37015 Oak View Rd
- 37045 Oak View Rd
- 37040 Oak View Rd
- 37020 Oak View Rd
- 36999 Oak View Rd
- 37010 Oak View Rd
- 37060 Oak View Rd
- 37065 Oak View Rd
- 0 Oak View Rd Unit EV18098047
- 0 Oak View Rd Unit EV17154817
- 0 Oak View Rd Unit EV21064249
- 0 Oak View Rd Unit EV20122755
- 0 Oak View Rd Unit EV19114069
- 36989 Oak View Rd
- 37000 Oak View Rd
- 37075 Oak View Rd
- 36992 Wildwood
- 36992 Wildwood Canyon Rd
- 36972 Wildwood Canyon Rd
- 3700 Oak View Rd
Your Personal Tour Guide
Ask me questions while you tour the home.