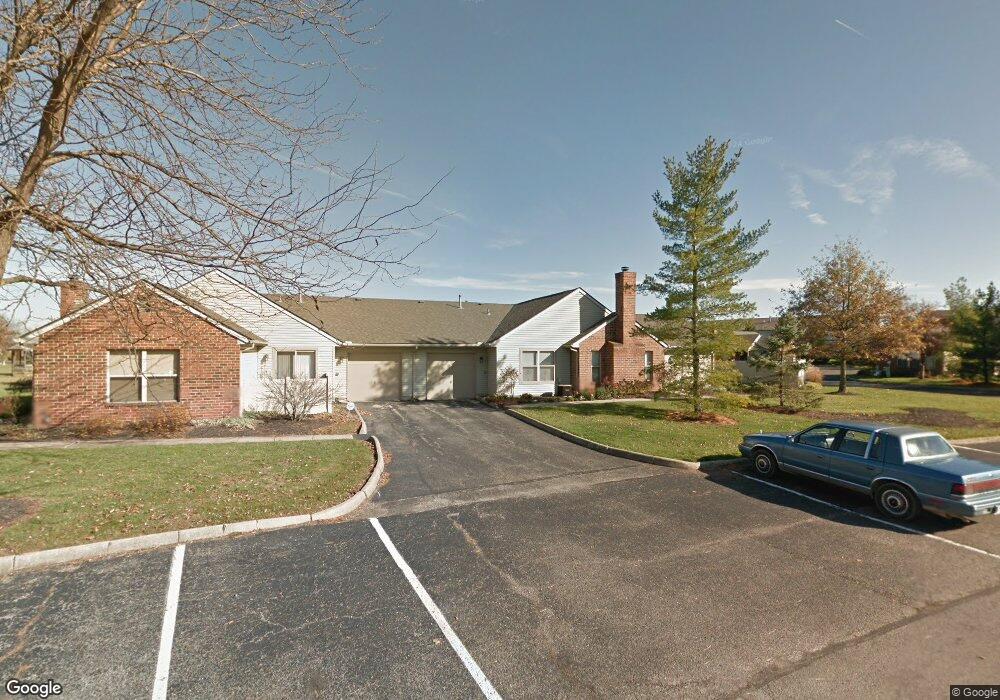
3703 Charlemonte Way Unit 3-3685 Canal Winchester, OH 43110
Estimated Value: $175,000 - $182,738
2
Beds
2
Baths
1,069
Sq Ft
$169/Sq Ft
Est. Value
About This Home
This home is located at 3703 Charlemonte Way Unit 3-3685, Canal Winchester, OH 43110 and is currently estimated at $180,435, approximately $168 per square foot. 3703 Charlemonte Way Unit 3-3685 is a home located in Franklin County with nearby schools including Groveport Madison High School, A+ Arts Academy, and Brice Christian Academy Elementary School.
Ownership History
Date
Name
Owned For
Owner Type
Purchase Details
Closed on
Nov 29, 2023
Sold by
Ctgr Renovations Llc
Bought by
Sandhu Ajaib and Bhullar Kabul
Current Estimated Value
Purchase Details
Closed on
Nov 13, 2023
Sold by
Ctgr Renovations Llc
Bought by
Sandhu Ajaib and Bhullar Kabul
Purchase Details
Closed on
Apr 13, 2018
Sold by
Moses John R
Bought by
Ctgr Renovations Llc
Purchase Details
Closed on
Jan 10, 2018
Sold by
Harkins Charlene
Bought by
Moses John R
Purchase Details
Closed on
Dec 14, 2017
Sold by
Harkins Charlene
Bought by
Harkins Betty Lou
Purchase Details
Closed on
May 20, 2004
Sold by
Gravely Sue
Bought by
Harkins Betty Lou
Purchase Details
Closed on
Dec 7, 1994
Sold by
T & R Dev Inc
Bought by
Gravely Sue
Home Financials for this Owner
Home Financials are based on the most recent Mortgage that was taken out on this home.
Original Mortgage
$30,000
Interest Rate
9.06%
Mortgage Type
FHA
Create a Home Valuation Report for This Property
The Home Valuation Report is an in-depth analysis detailing your home's value as well as a comparison with similar homes in the area
Home Values in the Area
Average Home Value in this Area
Purchase History
| Date | Buyer | Sale Price | Title Company |
|---|---|---|---|
| Sandhu Ajaib | $168,000 | Elite Land Title | |
| Sandhu Ajaib | $168,000 | Elite Land Title | |
| Ctgr Renovations Llc | $86,000 | None Available | |
| Moses John R | $50,800 | None Available | |
| Harkins Betty Lou | -- | None Available | |
| Harkins Betty Lou | $104,000 | -- | |
| Gravely Sue | $81,150 | -- |
Source: Public Records
Mortgage History
| Date | Status | Borrower | Loan Amount |
|---|---|---|---|
| Previous Owner | Gravely Sue | $30,000 |
Source: Public Records
Tax History Compared to Growth
Tax History
| Year | Tax Paid | Tax Assessment Tax Assessment Total Assessment is a certain percentage of the fair market value that is determined by local assessors to be the total taxable value of land and additions on the property. | Land | Improvement |
|---|---|---|---|---|
| 2024 | $1,759 | $41,480 | $8,750 | $32,730 |
| 2023 | $1,784 | $41,480 | $8,750 | $32,730 |
| 2022 | $1,605 | $30,600 | $5,080 | $25,520 |
| 2021 | $1,586 | $30,600 | $5,080 | $25,520 |
| 2020 | $1,739 | $30,600 | $5,080 | $25,520 |
| 2019 | $1,376 | $21,110 | $3,500 | $17,610 |
| 2018 | $1,092 | $21,110 | $3,500 | $17,610 |
| 2017 | $823 | $21,110 | $3,500 | $17,610 |
| 2016 | $939 | $23,740 | $3,960 | $19,780 |
| 2015 | $949 | $23,740 | $3,960 | $19,780 |
| 2014 | $960 | $23,740 | $3,960 | $19,780 |
| 2013 | $514 | $27,930 | $4,655 | $23,275 |
Source: Public Records
Map
Nearby Homes
- 6400 Old Ben Ln
- 3471 Treehouse Ln
- 6523 Dorothys Creek
- 6747 Dorothys Crossing Unit 6747
- 6800 Barker Dr
- 6167 Kensington Glen Dr
- 3345 Trentshire Dr
- St Martin Plan at Chatterton Commons
- 5978 Abernathy Ln
- 5976 Abernathy Ln
- 5970 Abernathy Ln
- 5968 Abernathy Ln
- 5962 Abernathy Ln
- 5987 Hollett Dr S
- 5960 Abernathy Ln
- 3624 Peany Ln
- 5946 Abernathy Ln
- 5969 Hollett Dr S
- 5944 Abernathy Ln
- 5938 Abernathy Ln
- 3703 Charlemonte Way Unit 63703
- 3703 Charlemonte Way Unit 6
- 6372 Lowridge Dr
- 6372 Lowridge Dr Unit 6
- 3681 Charlemonte Way
- 3701 Charlemonte Way
- 6370 Lowridge Dr Unit 6
- 6370 Lowridge Dr Unit 6-63
- 3861 Charlemonte Way
- 3700 Charlemonte Way Unit 5
- 3695 Charlemonte Way
- 3695 Charlemonte Way Unit 4
- 3697 Charlemonte Way Unit 43697
- 3687 Charlemonte Way
- 6388 Lowridge Dr
- 3693 Charlemonte Way
- 3691 Charlemonte Way Unit R3691
- 3685 Charlemonte Way
- 3698 Charlemonte Way Unit 53698
- 3683 Charlemonte Way