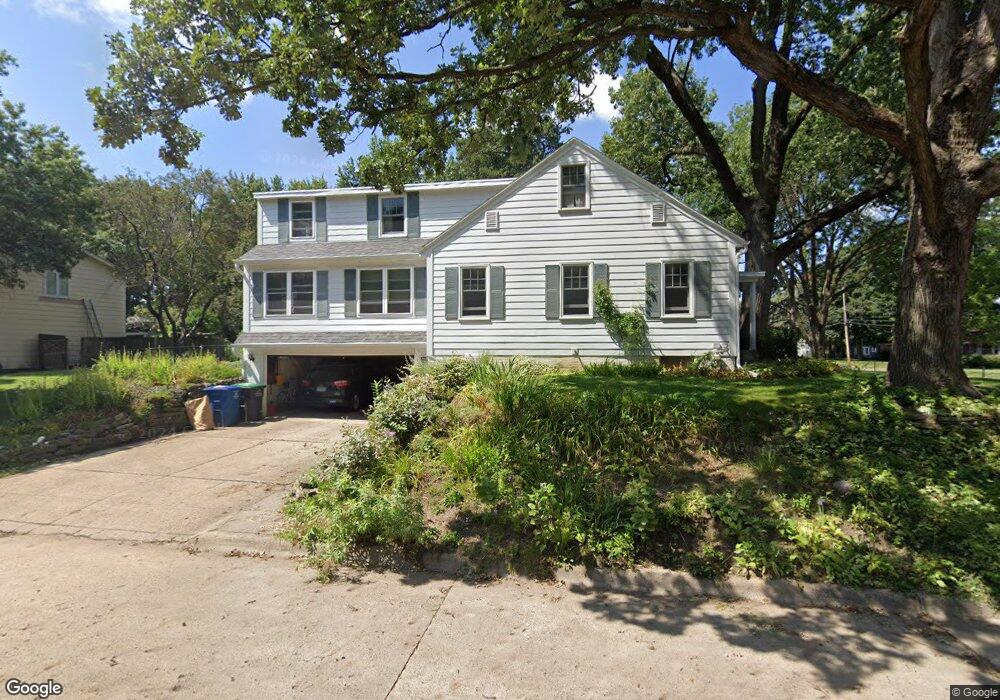
3704 Adams Ave Des Moines, IA 50310
Beaverdale NeighborhoodEstimated Value: $362,390 - $421,000
5
Beds
2
Baths
2,416
Sq Ft
$158/Sq Ft
Est. Value
About This Home
This home is located at 3704 Adams Ave, Des Moines, IA 50310 and is currently estimated at $382,848, approximately $158 per square foot. 3704 Adams Ave is a home located in Polk County with nearby schools including Moore Elementary School, Meredith Middle School, and Hoover High School.
Ownership History
Date
Name
Owned For
Owner Type
Purchase Details
Closed on
Jan 16, 2025
Sold by
Rendon Thomas T and Rendon Julia T
Bought by
Rendon Thomas T and Rendon Julia T
Current Estimated Value
Purchase Details
Closed on
Sep 15, 2000
Sold by
Parks Linda Michaeleen
Bought by
Rendon Thomas T and Rendon Julia T
Home Financials for this Owner
Home Financials are based on the most recent Mortgage that was taken out on this home.
Original Mortgage
$69,000
Interest Rate
8.14%
Create a Home Valuation Report for This Property
The Home Valuation Report is an in-depth analysis detailing your home's value as well as a comparison with similar homes in the area
Home Values in the Area
Average Home Value in this Area
Purchase History
| Date | Buyer | Sale Price | Title Company |
|---|---|---|---|
| Rendon Thomas T | -- | None Listed On Document | |
| Rendon Thomas T | -- | None Listed On Document | |
| Rendon Thomas T | -- | None Listed On Document | |
| Rendon Thomas T | -- | -- | |
| Rendon Thomas T | $138,000 | -- |
Source: Public Records
Mortgage History
| Date | Status | Borrower | Loan Amount |
|---|---|---|---|
| Previous Owner | Rendon Thomas T | $69,000 |
Source: Public Records
Tax History Compared to Growth
Tax History
| Year | Tax Paid | Tax Assessment Tax Assessment Total Assessment is a certain percentage of the fair market value that is determined by local assessors to be the total taxable value of land and additions on the property. | Land | Improvement |
|---|---|---|---|---|
| 2025 | $6,090 | $353,700 | $68,700 | $285,000 |
| 2024 | $6,090 | $320,000 | $61,100 | $258,900 |
| 2023 | $6,268 | $320,000 | $61,100 | $258,900 |
| 2022 | $6,218 | $274,800 | $53,900 | $220,900 |
| 2021 | $6,204 | $274,800 | $53,900 | $220,900 |
| 2020 | $6,440 | $257,200 | $50,400 | $206,800 |
| 2019 | $6,060 | $257,200 | $50,400 | $206,800 |
| 2018 | $5,994 | $234,000 | $44,700 | $189,300 |
| 2017 | $5,446 | $234,000 | $44,700 | $189,300 |
| 2016 | $5,302 | $209,900 | $39,600 | $170,300 |
| 2015 | $5,302 | $209,900 | $39,600 | $170,300 |
| 2014 | $4,986 | $203,600 | $37,600 | $166,000 |
Source: Public Records
Map
Nearby Homes
- 3711 Adams Ave
- 3514 Urbandale Ave
- 3514 Davisson Rd
- 3501 Sheridan Ave
- 3605 Davisson Rd
- 2500 38th St
- 3301 34th St
- 2421 39th St
- 2614 40th Place
- 3112 Sheridan Ave
- 2513 33rd St
- 3016 30th St
- 3120 30th St
- 2419 40th Place
- 2309 37th St
- 2310 35th St
- 3112 Beaver Ave
- 3109 Holcomb Ave
- 3616 37th St
- 2415 Hickman Rd