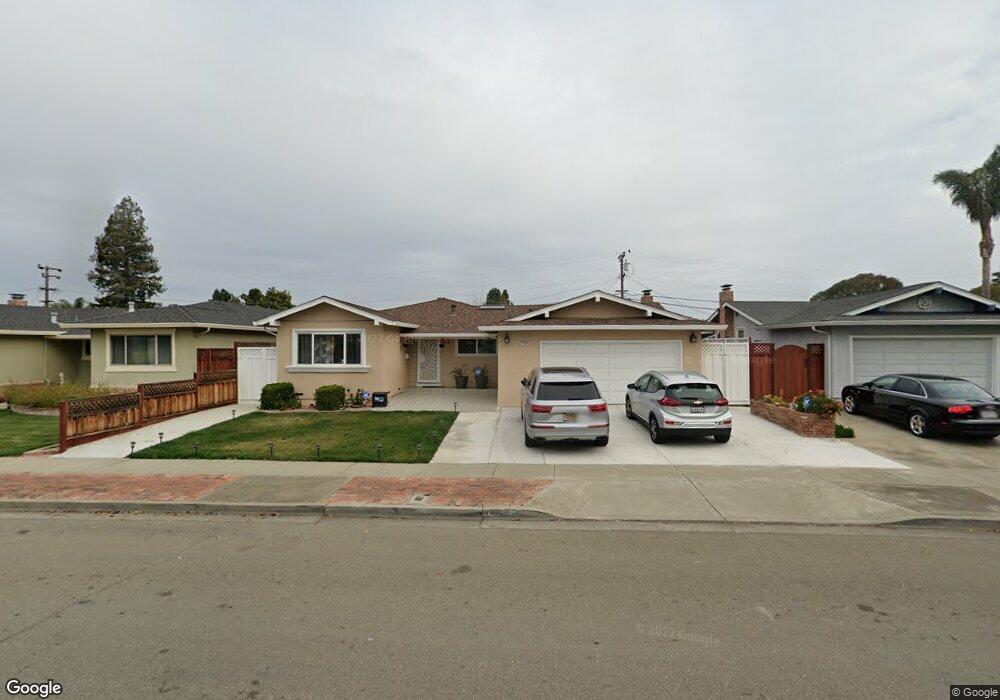
37048 Contra Costa Ave Fremont, CA 94536
Centerville District NeighborhoodEstimated Value: $1,609,000 - $1,678,767
4
Beds
2
Baths
1,587
Sq Ft
$1,034/Sq Ft
Est. Value
About This Home
This home is located at 37048 Contra Costa Ave, Fremont, CA 94536 and is currently estimated at $1,641,692, approximately $1,034 per square foot. 37048 Contra Costa Ave is a home located in Alameda County with nearby schools including Oliveira Elementary School, Thornton Middle School, and American High School.
Ownership History
Date
Name
Owned For
Owner Type
Purchase Details
Closed on
May 12, 2022
Sold by
Vashisht Manoj and Vashisht Rachna
Bought by
Vashisht Family Trust and Vashisht
Current Estimated Value
Purchase Details
Closed on
May 14, 2018
Sold by
Okh Roman and Geller Okh Stella
Bought by
Rana Rachna and Vashisht Manoj
Home Financials for this Owner
Home Financials are based on the most recent Mortgage that was taken out on this home.
Original Mortgage
$988,000
Interest Rate
4.37%
Mortgage Type
Adjustable Rate Mortgage/ARM
Purchase Details
Closed on
Oct 27, 1998
Sold by
Saminathan Ragavan and Saminathan Brenda K
Bought by
Okh Roman and Gallar Okh Stella
Home Financials for this Owner
Home Financials are based on the most recent Mortgage that was taken out on this home.
Original Mortgage
$198,750
Interest Rate
6.6%
Purchase Details
Closed on
Aug 28, 1996
Sold by
Leontiades Mike and Leontiades Mary A
Bought by
Saminathen Ragavan and Saminathen Brenda K
Home Financials for this Owner
Home Financials are based on the most recent Mortgage that was taken out on this home.
Original Mortgage
$206,150
Interest Rate
6.5%
Create a Home Valuation Report for This Property
The Home Valuation Report is an in-depth analysis detailing your home's value as well as a comparison with similar homes in the area
Home Values in the Area
Average Home Value in this Area
Purchase History
| Date | Buyer | Sale Price | Title Company |
|---|---|---|---|
| Vashisht Family Trust | -- | Anthoor Swapna | |
| Rana Rachna | $1,235,000 | Fidelity National Title Comp | |
| Okh Roman | $265,000 | Fidelity National Title Ins | |
| Saminathen Ragavan | $235,000 | Fidelity National Title Ins |
Source: Public Records
Mortgage History
| Date | Status | Borrower | Loan Amount |
|---|---|---|---|
| Previous Owner | Rana Rachna | $988,000 | |
| Previous Owner | Okh Roman | $198,750 | |
| Previous Owner | Saminathen Ragavan | $206,150 |
Source: Public Records
Tax History Compared to Growth
Tax History
| Year | Tax Paid | Tax Assessment Tax Assessment Total Assessment is a certain percentage of the fair market value that is determined by local assessors to be the total taxable value of land and additions on the property. | Land | Improvement |
|---|---|---|---|---|
| 2025 | $16,426 | $1,405,195 | $455,124 | $950,071 |
| 2024 | $16,426 | $1,377,642 | $446,200 | $931,442 |
| 2023 | $16,002 | $1,350,633 | $437,452 | $913,181 |
| 2022 | $15,818 | $1,324,154 | $428,876 | $895,278 |
| 2021 | $15,425 | $1,298,194 | $420,468 | $877,726 |
| 2020 | $15,540 | $1,284,894 | $416,160 | $868,734 |
| 2019 | $15,360 | $1,259,700 | $408,000 | $851,700 |
| 2018 | $4,917 | $368,165 | $109,531 | $258,634 |
| 2017 | $4,760 | $357,948 | $107,384 | $250,564 |
| 2016 | $4,672 | $350,931 | $105,279 | $245,652 |
| 2015 | $4,602 | $345,660 | $103,698 | $241,962 |
| 2014 | $4,518 | $338,888 | $101,666 | $237,222 |
Source: Public Records
Map
Nearby Homes
- 37001 Contra Costa Ave
- 4544 Thornton Ave
- 4637 Rothbury Common
- 4543 Bartolo Terrace
- 4632 Balboa Way
- 4412 Elaiso Common
- 4737 Deadwood Dr
- 37114 Dondero Way
- 37621 Glenmoor Dr
- 36521 Cabrillo Dr
- Plan 1725 at Veranda
- Plan 1670 at Veranda
- Plan 1657 at Veranda
- Plan 1629 at Veranda
- Plan 1455 at Veranda
- Plan 1394 at Veranda
- Plan 1378 at Veranda
- Plan 1165 at Veranda
- 36304 Magellan Dr
- 36347 Magellan Dr
- 37036 Contra Costa Ave
- 37060 Contra Costa Ave
- 37057 Lassen St
- 37024 Contra Costa Ave
- 37072 Contra Costa Ave
- 37049 Lassen St
- 37065 Lassen St
- 37041 Lassen St
- 37073 Lassen St
- 37047 Contra Costa Ave
- 37012 Contra Costa Ave
- 37035 Contra Costa Ave
- 37059 Contra Costa Ave
- 37023 Contra Costa Ave
- 37033 Lassen St
- 37071 Contra Costa Ave
- 37011 Contra Costa Ave
- 37060 Lassen St
- 4550 Santa Cruz Ct
- 4457 Alameda Dr