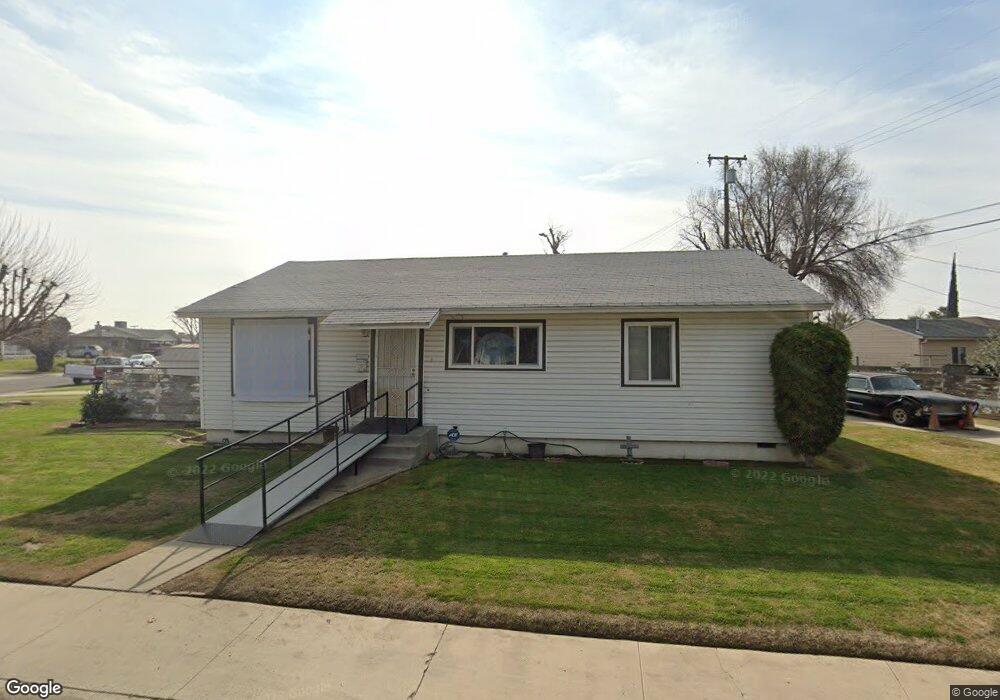
3705 Peckham Ave Bakersfield, CA 93309
Southwest Bakersfield NeighborhoodEstimated Value: $249,598 - $298,000
3
Beds
1
Bath
1,144
Sq Ft
$239/Sq Ft
Est. Value
About This Home
This home is located at 3705 Peckham Ave, Bakersfield, CA 93309 and is currently estimated at $273,150, approximately $238 per square foot. 3705 Peckham Ave is a home located in Kern County with nearby schools including Munsey Elementary School, Curran Middle School, and West High School.
Ownership History
Date
Name
Owned For
Owner Type
Purchase Details
Closed on
Dec 19, 2001
Sold by
Groves Cris E and Johnson Eric W
Bought by
Groves Cris E and Reese James R
Current Estimated Value
Purchase Details
Closed on
Dec 17, 1997
Sold by
Hud
Bought by
Groves Cris E and Wright Sara E
Home Financials for this Owner
Home Financials are based on the most recent Mortgage that was taken out on this home.
Original Mortgage
$54,850
Outstanding Balance
$9,222
Interest Rate
7.16%
Mortgage Type
FHA
Estimated Equity
$263,928
Purchase Details
Closed on
Jul 30, 1997
Sold by
Corbett Michael P
Bought by
Source One Mtg Services Corp
Purchase Details
Closed on
May 30, 1997
Sold by
Source One Mtg Services Corp
Bought by
Hud
Purchase Details
Closed on
Mar 23, 1995
Sold by
Williams Bill L
Bought by
Corbett Michael P
Home Financials for this Owner
Home Financials are based on the most recent Mortgage that was taken out on this home.
Original Mortgage
$71,421
Interest Rate
8.47%
Mortgage Type
FHA
Create a Home Valuation Report for This Property
The Home Valuation Report is an in-depth analysis detailing your home's value as well as a comparison with similar homes in the area
Home Values in the Area
Average Home Value in this Area
Purchase History
| Date | Buyer | Sale Price | Title Company |
|---|---|---|---|
| Groves Cris E | $66,000 | -- | |
| Groves Cris E | $60,500 | American Title Co | |
| Source One Mtg Services Corp | $77,834 | Fidelity National Title Ins | |
| Hud | -- | -- | |
| Corbett Michael P | $73,000 | Stewart Title | |
| Williams Bill L | -- | Stewart Title | |
| Williams Bill L | -- | Stewart Title |
Source: Public Records
Mortgage History
| Date | Status | Borrower | Loan Amount |
|---|---|---|---|
| Open | Groves Cris E | $54,850 | |
| Previous Owner | Corbett Michael P | $71,421 |
Source: Public Records
Tax History
| Year | Tax Paid | Tax Assessment Tax Assessment Total Assessment is a certain percentage of the fair market value that is determined by local assessors to be the total taxable value of land and additions on the property. | Land | Improvement |
|---|---|---|---|---|
| 2025 | $1,596 | $95,774 | $39,905 | $55,869 |
| 2024 | $1,596 | $93,897 | $39,123 | $54,774 |
| 2023 | $1,545 | $92,056 | $38,356 | $53,700 |
| 2022 | $1,472 | $90,252 | $37,604 | $52,648 |
| 2021 | $1,385 | $88,483 | $36,867 | $51,616 |
| 2020 | $1,342 | $87,576 | $36,489 | $51,087 |
| 2019 | $1,314 | $87,576 | $36,489 | $51,087 |
| 2018 | $1,269 | $84,177 | $35,073 | $49,104 |
| 2017 | $1,257 | $82,528 | $34,386 | $48,142 |
| 2016 | $1,161 | $80,911 | $33,712 | $47,199 |
| 2015 | $1,159 | $79,697 | $33,206 | $46,491 |
| 2014 | $1,126 | $78,137 | $32,556 | $45,581 |
Source: Public Records
Map
Nearby Homes
- 305 Jones St
- 108 Curran St
- 513 Prosser Ave
- 402 Westwood St
- 9 Dunlap St
- 4412 Joanne Ave
- 3820 Apache Ave
- 3800 Stockdale Hwy Unit 2
- 4600 Randy Ave
- 225 Bloomquist Dr
- 4424 Belle Terrace
- 225 Blomquist Dr
- 4420 4424 Belle Terrace
- 3714 Brave Ave
- 240 S Real Rd
- 4714 Frazier Ave
- 1001 McDonald Way Unit 40
- 4629 Fishering Dr
- 912 Valhalla Dr
- 207 N Stine Rd
- 209 Jones St
- 204 Griffiths St
- 3715 Peckham Ave
- 3706 Peckham Ave
- 208 Griffiths St
- 212 Griffiths St
- 204 Jones St
- 213 Jones St
- 129 Jones St
- 3716 Peckham Ave
- 216 Griffiths St
- 3612 Peckham Ave
- 3613 Peckham Ave
- 301 Jones St
- 301 Jones St
- 214 Jones St
- 125 Jones St
- 300 Griffiths St
- 124 Griffiths St
- 216 Jones St
Your Personal Tour Guide
Ask me questions while you tour the home.