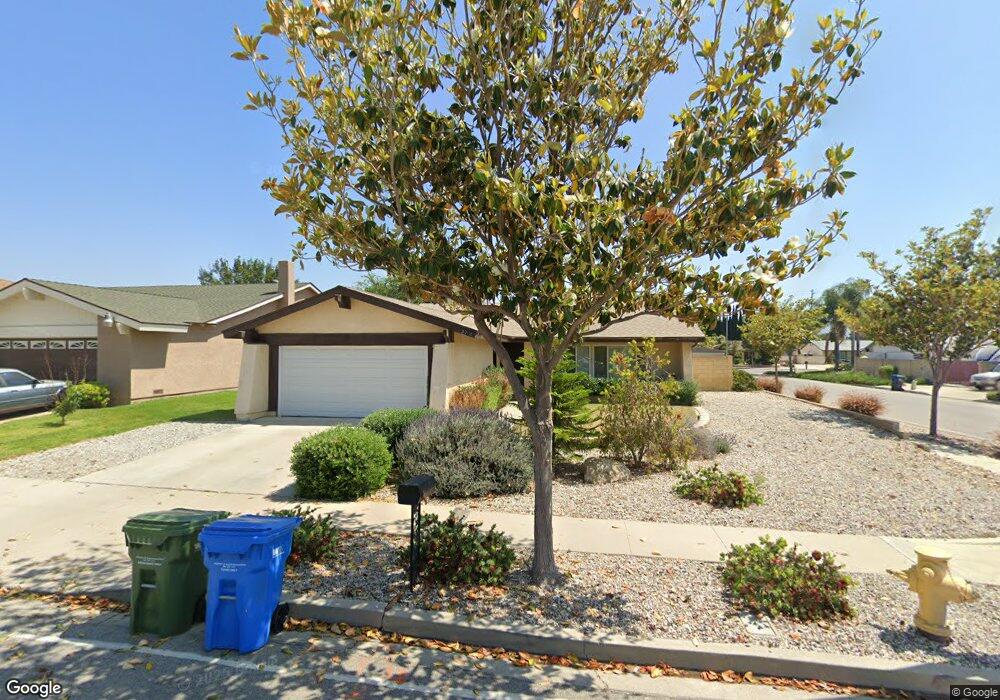
3706 Knightwood Cir Simi Valley, CA 93063
Central Simi Valley NeighborhoodEstimated Value: $726,741 - $882,000
3
Beds
2
Baths
1,229
Sq Ft
$633/Sq Ft
Est. Value
About This Home
This home is located at 3706 Knightwood Cir, Simi Valley, CA 93063 and is currently estimated at $777,935, approximately $632 per square foot. 3706 Knightwood Cir is a home located in Ventura County with nearby schools including Garden Grove Elementary School, Valley View Middle School, and Simi Valley High School.
Ownership History
Date
Name
Owned For
Owner Type
Purchase Details
Closed on
Oct 31, 2022
Sold by
Marzan Joseph and Marzan Deborah
Bought by
Marzan Family Trust
Current Estimated Value
Purchase Details
Closed on
Aug 20, 2002
Sold by
Ferris Mary M
Bought by
Ferris Mary M
Home Financials for this Owner
Home Financials are based on the most recent Mortgage that was taken out on this home.
Original Mortgage
$152,000
Interest Rate
6.25%
Mortgage Type
Negative Amortization
Purchase Details
Closed on
Jul 23, 2001
Sold by
Ferris Mary
Bought by
Ferris Mary M
Purchase Details
Closed on
Sep 27, 1999
Sold by
Gertrude Rogowski
Bought by
Ferris Mary and Marzan Joseph
Home Financials for this Owner
Home Financials are based on the most recent Mortgage that was taken out on this home.
Original Mortgage
$101,000
Interest Rate
3.85%
Create a Home Valuation Report for This Property
The Home Valuation Report is an in-depth analysis detailing your home's value as well as a comparison with similar homes in the area
Home Values in the Area
Average Home Value in this Area
Purchase History
| Date | Buyer | Sale Price | Title Company |
|---|---|---|---|
| Marzan Family Trust | -- | -- | |
| Ferris Mary M | -- | First American Title Ins Co | |
| Ferris Mary M | -- | First American Title Ins Co | |
| Ferris Mary M | -- | -- | |
| Ferris Mary | $194,500 | Old Republic Title Company |
Source: Public Records
Mortgage History
| Date | Status | Borrower | Loan Amount |
|---|---|---|---|
| Previous Owner | Ferris Mary M | $152,000 | |
| Previous Owner | Ferris Mary | $101,000 |
Source: Public Records
Tax History Compared to Growth
Tax History
| Year | Tax Paid | Tax Assessment Tax Assessment Total Assessment is a certain percentage of the fair market value that is determined by local assessors to be the total taxable value of land and additions on the property. | Land | Improvement |
|---|---|---|---|---|
| 2025 | $3,998 | $298,676 | $119,467 | $179,209 |
| 2024 | $3,998 | $292,820 | $117,124 | $175,696 |
| 2023 | $3,757 | $287,079 | $114,828 | $172,251 |
| 2022 | $3,725 | $281,450 | $112,576 | $168,874 |
| 2021 | $3,683 | $275,932 | $110,369 | $165,563 |
| 2020 | $3,596 | $273,105 | $109,239 | $163,866 |
| 2019 | $3,431 | $267,751 | $107,098 | $160,653 |
| 2018 | $3,392 | $262,502 | $104,999 | $157,503 |
| 2017 | $3,309 | $257,356 | $102,941 | $154,415 |
| 2016 | $3,158 | $252,311 | $100,923 | $151,388 |
| 2015 | $3,083 | $248,523 | $99,408 | $149,115 |
| 2014 | $3,031 | $243,656 | $97,461 | $146,195 |
Source: Public Records
Map
Nearby Homes
- 2439 Lita Place
- 3867 Delano Ct
- 3474 Highwood Ct Unit 80
- 3845 Bayside St
- 3434 Highwood Ct Unit 183
- 3954 Cochran St Unit 61
- 2250 N Goddard Ave
- 3998 Celia Ct
- 2085 Bolivar Ct
- 2433 Medina Ave
- 3342 Darby St Unit 317
- 2514 Glenhurst Ct
- 3306 Darby St Unit 402
- 2358 Medina Ave
- 3887 Aztec Ct
- 3204 Darby St Unit 118
- 3872 Aztec Ct
- 3192 Darby St Unit 114
- 3326 Wilmot St
- 2885 Circle View Dr
- 3718 Knightwood Cir
- 3705 Woodhaven St
- 3717 Woodhaven St
- 3726 Knightwood Cir
- 2429 Knightwood Place
- 2437 Knightwood Place
- 3707 Knightwood Cir
- 3667 Woodhaven St
- 3725 Woodhaven St
- 3719 Knightwood Cir
- 2443 Knightwood Place
- 2445 Knightwood Cir
- 3661 Woodhaven St
- 3738 Knightwood Cir
- 3737 Woodhaven St
- 2451 Knightwood Place
- 2458 Knightwood Place
- 2428 Castlemont Ct
- 2442 Castlemont Ct
- 3704 Woodhaven St