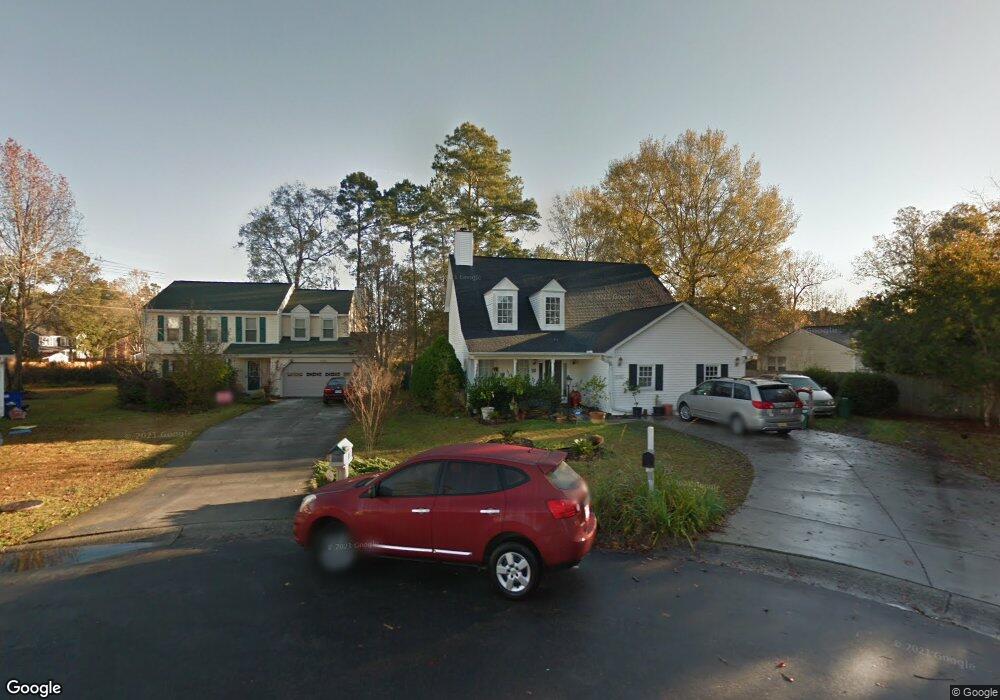
3706 Stone Mill Ct North Charleston, SC 29420
Estimated Value: $331,000 - $351,788
4
Beds
3
Baths
2,300
Sq Ft
$149/Sq Ft
Est. Value
About This Home
This home is located at 3706 Stone Mill Ct, North Charleston, SC 29420 and is currently estimated at $341,947, approximately $148 per square foot. 3706 Stone Mill Ct is a home located in Dorchester County with nearby schools including Windsor Hill Arts Infused Elementary School, River Oaks Middle School, and Fort Dorchester High School.
Ownership History
Date
Name
Owned For
Owner Type
Purchase Details
Closed on
Aug 27, 2011
Sold by
Krulia T A
Bought by
Ososki Kenneth J
Current Estimated Value
Purchase Details
Closed on
Mar 15, 2007
Sold by
Krulia Timothy A
Bought by
Riddle P L
Home Financials for this Owner
Home Financials are based on the most recent Mortgage that was taken out on this home.
Original Mortgage
$160,000
Interest Rate
6.1%
Mortgage Type
Assumption
Purchase Details
Closed on
Feb 21, 2007
Sold by
Whitsitt S J
Bought by
Krulia Timothy A
Home Financials for this Owner
Home Financials are based on the most recent Mortgage that was taken out on this home.
Original Mortgage
$160,000
Interest Rate
6.1%
Mortgage Type
Assumption
Purchase Details
Closed on
Jul 25, 2006
Sold by
Guy Andrew C
Bought by
Whitsitt S J
Purchase Details
Closed on
May 3, 2002
Sold by
Kofold Frederick D and Kofold Kristin A
Bought by
Guy Andrew C
Create a Home Valuation Report for This Property
The Home Valuation Report is an in-depth analysis detailing your home's value as well as a comparison with similar homes in the area
Home Values in the Area
Average Home Value in this Area
Purchase History
| Date | Buyer | Sale Price | Title Company |
|---|---|---|---|
| Ososki Kenneth J | $51,000 | -- | |
| Riddle P L | -- | None Available | |
| Krulia Timothy A | $200,000 | None Available | |
| Whitsitt S J | $151,305 | None Available | |
| Guy Andrew C | $138,500 | -- |
Source: Public Records
Mortgage History
| Date | Status | Borrower | Loan Amount |
|---|---|---|---|
| Previous Owner | Riddle P L | $160,000 | |
| Previous Owner | Krulia Timothy A | $160,000 |
Source: Public Records
Tax History Compared to Growth
Tax History
| Year | Tax Paid | Tax Assessment Tax Assessment Total Assessment is a certain percentage of the fair market value that is determined by local assessors to be the total taxable value of land and additions on the property. | Land | Improvement |
|---|---|---|---|---|
| 2024 | $1,538 | $11,375 | $3,400 | $7,975 |
| 2023 | $1,538 | $7,314 | $1,800 | $5,514 |
| 2022 | $1,374 | $7,310 | $1,800 | $5,510 |
| 2021 | $1,374 | $7,310 | $1,800 | $5,510 |
| 2020 | $1,282 | $6,440 | $1,470 | $4,970 |
| 2019 | $1,242 | $6,440 | $1,470 | $4,970 |
| 2018 | $1,108 | $6,440 | $1,470 | $4,970 |
| 2017 | $1,101 | $6,440 | $1,470 | $4,970 |
| 2016 | $1,088 | $6,440 | $1,470 | $4,970 |
| 2015 | $1,084 | $6,440 | $1,470 | $4,970 |
| 2014 | $931 | $140,000 | $0 | $0 |
| 2013 | -- | $5,600 | $0 | $0 |
Source: Public Records
Map
Nearby Homes
- 8475 Scotts Mill Dr
- 8105 Halifax Way
- 3806 Grateful Rd
- 3813 Battleview Ct
- 3802 Grateful Rd
- 8212 Continental Ct
- 8534 Sentry Cir
- 3900 Greico Rd
- 4105 Senegal Ct
- 8113 Pleasant Ridge Dr
- 8213 N Split Oak
- 8352 Coventry Ct
- 8201 Timberidge Ct
- 8152 N Ridgebrook Dr
- 8319 Coventry Ct
- 8254 Timberidge Ct
- 8151 N Ridgebrook Dr
- 8248 Timberidge Ct
- 8628 Windsor Hill Blvd
- 8640 Windsor Hill Blvd
- 3702 Stone Mill Ct
- 8140 Halifax Way
- 3701 Stone Mill Ct
- 8142 Halifax Way
- 8138 Halifax Way
- 8471 Scotts Mill Dr
- 3705 Stone Mill Ct
- 8144 Halifax Way
- 3711 Stone Mill Ct
- 8136 Halifax Way
- 8467 Scotts Mill Dr
- 8146 Halifax Way
- 8134 Lansbury Ct
- 8137 Halifax Way
- 8135 Halifax Way
- 8479 Scotts Mill Dr
- 4220 Stone Mill Ct
- 8103 Bankshire Trail
- 8463 Scotts Mill Dr
- 8132 Lansbury Ct