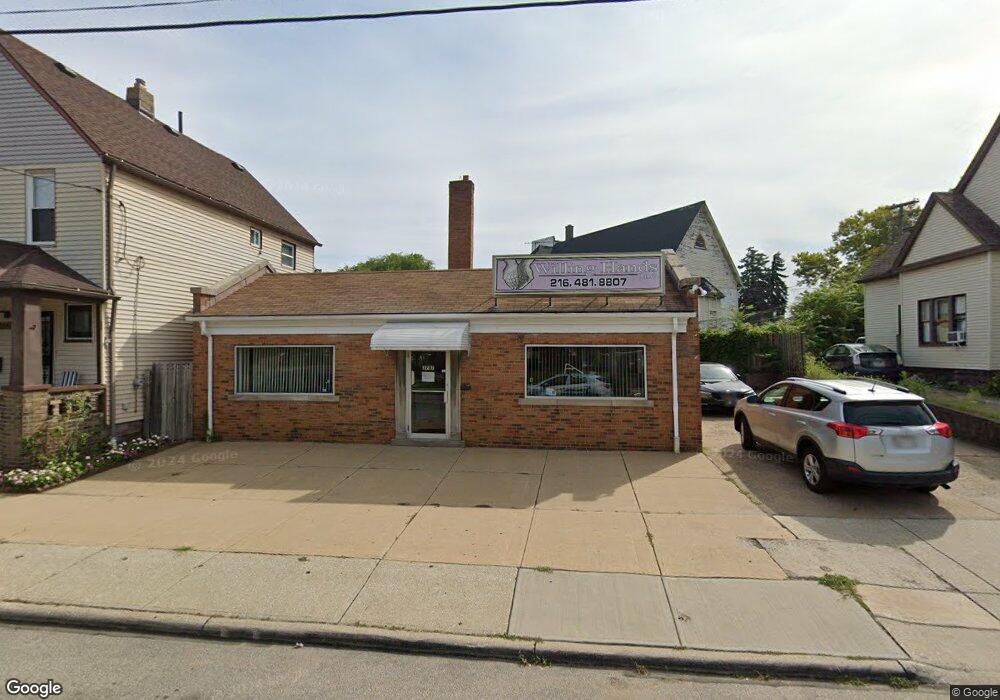
3707 E 71st St Cleveland, OH 44105
Slavic Village NeighborhoodEstimated Value: $69,125
--
Bed
--
Bath
1,820
Sq Ft
$38/Sq Ft
Est. Value
About This Home
This home is located at 3707 E 71st St, Cleveland, OH 44105 and is currently estimated at $69,125, approximately $37 per square foot. 3707 E 71st St is a home located in Cuyahoga County with nearby schools including Anton Grdina School, Bolton, and Andrew J. Rickoff School.
Ownership History
Date
Name
Owned For
Owner Type
Purchase Details
Closed on
Nov 30, 2015
Sold by
Radziszewski Zdzislaw and Radziszewski Vicki
Bought by
E&E Group Llc
Current Estimated Value
Purchase Details
Closed on
Dec 1, 1994
Sold by
Harstone Properties
Bought by
Radziszewski Zdzislaw and Radziszewski Vicki
Purchase Details
Closed on
Apr 15, 1992
Sold by
Johnstone Thomas H
Bought by
Harstone Properties An
Purchase Details
Closed on
Apr 19, 1990
Bought by
Johnstone Thomas H
Purchase Details
Closed on
Dec 20, 1989
Bought by
S V Investments Corp
Purchase Details
Closed on
Dec 29, 1987
Sold by
Klonowski Bernard P
Bought by
Klonowski Adelaide N
Purchase Details
Closed on
Jun 29, 1984
Bought by
Klonowski Bernard P
Purchase Details
Closed on
Jun 8, 1984
Sold by
Klonowski Stanley
Bought by
Klonowski Bernard P Trs
Purchase Details
Closed on
Jan 1, 1975
Bought by
Klonowski Stanley
Create a Home Valuation Report for This Property
The Home Valuation Report is an in-depth analysis detailing your home's value as well as a comparison with similar homes in the area
Home Values in the Area
Average Home Value in this Area
Purchase History
| Date | Buyer | Sale Price | Title Company |
|---|---|---|---|
| E&E Group Llc | $32,500 | Chicago Title Insurance Co | |
| Radziszewski Zdzislaw | $40,000 | -- | |
| Harstone Properties An | -- | -- | |
| Johnstone Thomas H | $28,000 | -- | |
| S V Investments Corp | -- | -- | |
| S.V Investments Corp | -- | -- | |
| S.V Invesments Corp | -- | -- | |
| S V Invesments Corp | $47,000 | -- | |
| Klonowski Adelaide N | -- | -- | |
| Klonowski Bernard P | -- | -- | |
| Klonowski Bernard P Trs | -- | -- | |
| Klonowski Stanley | -- | -- |
Source: Public Records
Tax History Compared to Growth
Tax History
| Year | Tax Paid | Tax Assessment Tax Assessment Total Assessment is a certain percentage of the fair market value that is determined by local assessors to be the total taxable value of land and additions on the property. | Land | Improvement |
|---|---|---|---|---|
| 2024 | $1,164 | $11,270 | $3,255 | $8,015 |
| 2023 | $1,092 | $10,930 | $3,260 | $7,670 |
| 2022 | $1,090 | $10,920 | $3,260 | $7,670 |
| 2021 | $1,093 | $10,920 | $3,260 | $7,670 |
| 2020 | $1,136 | $10,920 | $3,260 | $7,670 |
| 2019 | $1,070 | $31,200 | $9,300 | $21,900 |
| 2018 | $522 | $10,920 | $3,260 | $7,670 |
| 2017 | $640 | $6,300 | $2,940 | $3,360 |
| 2016 | $640 | $6,300 | $2,940 | $3,360 |
| 2015 | $1,562 | $6,300 | $2,940 | $3,360 |
| 2014 | $1,562 | $15,440 | $3,260 | $12,180 |
Source: Public Records
Map
Nearby Homes
- 6729 Forman Ave
- 6901 Fullerton Ave
- 6719 Forman Ave
- 7427 Spafford Rd
- 6530 Sebert Ave
- 6522 Sebert Ave
- 3606 E 75th St
- 6709 Gertrude Ave
- 6520 Fleet Ave
- 6920 Hosmer Ave
- 3554 E 72nd St
- 3698 Abbey Ct Unit 13A
- 6401 Gertrude Ave
- 6917 Worley Ave
- 3553 E 76th St
- 3620 E 63rd St
- 6511 Lansing Ave
- 7738 Spafford Rd
- 7304 Worley Ave
- 7412 Worley Ave
- 3709 E 71st St
- 3705 E 71st St
- 3711 E 71st St
- 3721 E 71st St
- 3723 E 71st St
- 3710 E 71st St
- 3706 E 71st St
- 3714 E 71st St
- 3718 E 71st St Unit 1 Front
- 3718 E 71st St Unit 4 UP
- 3731 E 71st St
- 6918 Chambers Ave
- 3735 E 71st St
- 3732 E 71st St
- 3741 E 71st St
- 3743 E 71st St
- 3709 E 69th St
- 3705 E 69th St
- 3713 E 69th St
- 3701 E 69th St