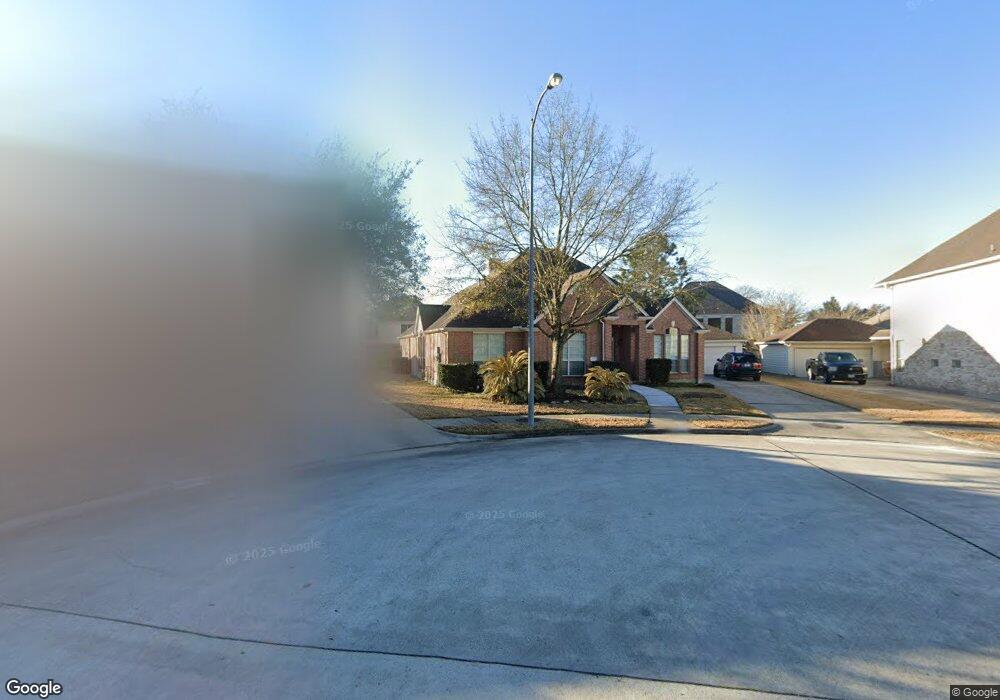
3707 Tarawood Ct Spring, TX 77388
Estimated Value: $389,710 - $397,000
4
Beds
4
Baths
2,746
Sq Ft
$143/Sq Ft
Est. Value
About This Home
This home is located at 3707 Tarawood Ct, Spring, TX 77388 and is currently estimated at $393,678, approximately $143 per square foot. 3707 Tarawood Ct is a home located in Harris County with nearby schools including Haude Elementary School, Strack Intermediate School, and Klein Collins High School.
Ownership History
Date
Name
Owned For
Owner Type
Purchase Details
Closed on
Oct 15, 2024
Sold by
Miller Benjamin
Bought by
Miller Keisha M
Current Estimated Value
Purchase Details
Closed on
Dec 14, 2016
Sold by
Anderson Kenneth L and Anderson May Dee
Bought by
Miller Keisha and Miller Benjamin
Home Financials for this Owner
Home Financials are based on the most recent Mortgage that was taken out on this home.
Original Mortgage
$234,671
Interest Rate
4.4%
Mortgage Type
FHA
Purchase Details
Closed on
Dec 10, 1999
Sold by
Pulte Homes Of Texas
Bought by
Anderson Kenneth L and Anderson Amy Dee
Home Financials for this Owner
Home Financials are based on the most recent Mortgage that was taken out on this home.
Original Mortgage
$134,600
Interest Rate
7.37%
Create a Home Valuation Report for This Property
The Home Valuation Report is an in-depth analysis detailing your home's value as well as a comparison with similar homes in the area
Home Values in the Area
Average Home Value in this Area
Purchase History
| Date | Buyer | Sale Price | Title Company |
|---|---|---|---|
| Miller Keisha M | -- | None Listed On Document | |
| Miller Keisha M | -- | None Listed On Document | |
| Miller Keisha | -- | Great American Title | |
| Anderson Kenneth L | -- | -- |
Source: Public Records
Mortgage History
| Date | Status | Borrower | Loan Amount |
|---|---|---|---|
| Previous Owner | Miller Keisha | $234,671 | |
| Previous Owner | Anderson Kenneth L | $134,600 | |
| Closed | Anderson Kenneth L | $26,927 |
Source: Public Records
Tax History Compared to Growth
Tax History
| Year | Tax Paid | Tax Assessment Tax Assessment Total Assessment is a certain percentage of the fair market value that is determined by local assessors to be the total taxable value of land and additions on the property. | Land | Improvement |
|---|---|---|---|---|
| 2025 | $6,411 | $361,440 | $60,474 | $300,966 |
| 2024 | $6,411 | $332,058 | $60,474 | $271,584 |
| 2023 | $6,411 | $386,424 | $60,474 | $325,950 |
| 2022 | $7,326 | $318,057 | $60,474 | $257,583 |
| 2021 | $7,158 | $270,011 | $43,374 | $226,637 |
| 2020 | $6,953 | $235,000 | $43,374 | $191,626 |
| 2019 | $7,373 | $239,000 | $43,374 | $195,626 |
| 2018 | $3,239 | $239,000 | $43,374 | $195,626 |
| 2017 | $7,428 | $239,000 | $43,374 | $195,626 |
| 2016 | $8,264 | $265,906 | $43,374 | $222,532 |
| 2015 | $6,370 | $249,235 | $43,374 | $205,861 |
| 2014 | $6,370 | $225,550 | $43,374 | $182,176 |
Source: Public Records
Map
Nearby Homes
- 3711 Sapling Trail Ct
- 3614 Cedar Glen Ln
- 20106 Forest Dr
- 3702 Cypresswood Meadows Ct
- 20518 Benwest Ct
- 20614 Cypresswood Meadows Dr
- 3602 Vashon Ln
- 19315 Puget Ln
- 20011 Rosswood Ln
- 2615 Piemonte Ln
- 20702 La Cote Cir
- 19218 Country Village Dr
- 19007 Pinewood Glen Dr
- 19502 Lakeside View Dr
- 4202 Blue Sage Terrace
- 20735 Deauville Dr
- 21306 N Tangle Creek Ln
- 20806 Deauville Dr
- 21218 N Tangle Creek Ln
- 4315 Countrycrossing Dr
- 3711 Tarawood Ct
- 3703 Tarawood Ct
- 3710 Ash Glen Dr
- 3714 Ash Glen Dr
- 3706 Ash Glen Dr
- 3715 Tarawood Ct
- 3718 Ash Glen Dr
- 3702 Tarawood Ct
- 20311 Forest Dr
- 3706 Tarawood Ct
- 20307 Forest Dr
- 3710 Tarawood Ct
- 20315 Forest Dr
- 20303 Forest Dr
- 3714 Tarawood Ct
- 20319 Forest Dr
- 20222 Ash Glen Ct
- 20223 Ash Glen Ct
- 3803 Tarawood Ct
- 3802 Ash Glen Dr