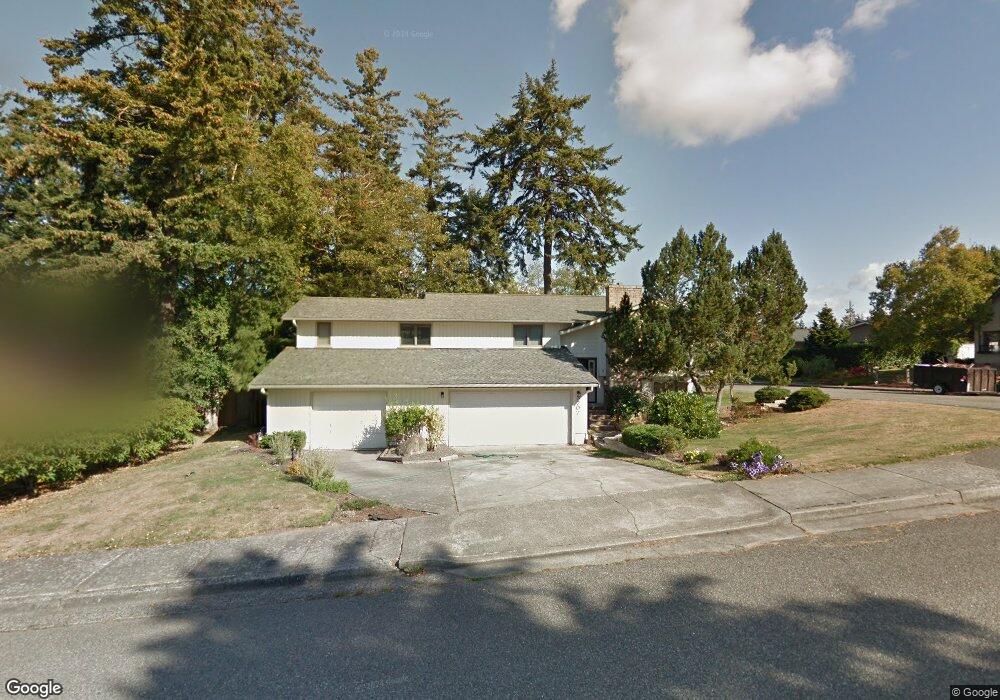
3707 Taylor Ave Bellingham, WA 98229
Samish NeighborhoodEstimated Value: $763,000 - $884,000
4
Beds
3
Baths
2,664
Sq Ft
$318/Sq Ft
Est. Value
About This Home
This home is located at 3707 Taylor Ave, Bellingham, WA 98229 and is currently estimated at $846,596, approximately $317 per square foot. 3707 Taylor Ave is a home located in Whatcom County with nearby schools including Happy Valley Elementary School, Fairhaven Middle School, and Sehome High School.
Ownership History
Date
Name
Owned For
Owner Type
Purchase Details
Closed on
Apr 18, 2011
Sold by
Fannie Mae
Bought by
Parry Vanessa and Parry Adam M
Current Estimated Value
Home Financials for this Owner
Home Financials are based on the most recent Mortgage that was taken out on this home.
Original Mortgage
$253,311
Outstanding Balance
$175,007
Interest Rate
4.83%
Mortgage Type
FHA
Estimated Equity
$671,589
Purchase Details
Closed on
May 5, 2010
Sold by
Aurora Loan Services Llc
Bought by
Federal National Mortgage Association
Purchase Details
Closed on
Apr 30, 2010
Sold by
Dinh Cuong and America Homekey Inc
Bought by
Aurora Loan Services Llc and Federal National Mortgage Association
Purchase Details
Closed on
Nov 16, 2006
Sold by
Strandy Corrine Elizabeth
Bought by
Dinh Cuong
Home Financials for this Owner
Home Financials are based on the most recent Mortgage that was taken out on this home.
Original Mortgage
$70,400
Interest Rate
6.37%
Mortgage Type
Stand Alone Second
Create a Home Valuation Report for This Property
The Home Valuation Report is an in-depth analysis detailing your home's value as well as a comparison with similar homes in the area
Home Values in the Area
Average Home Value in this Area
Purchase History
| Date | Buyer | Sale Price | Title Company |
|---|---|---|---|
| Parry Vanessa | $259,900 | Stewart Title Company | |
| Federal National Mortgage Association | -- | Chicago Title Insurance | |
| Aurora Loan Services Llc | $326,709 | Chicago Title Insurance | |
| Dinh Cuong | $352,280 | Chicago Title Insurance |
Source: Public Records
Mortgage History
| Date | Status | Borrower | Loan Amount |
|---|---|---|---|
| Open | Parry Vanessa | $253,311 | |
| Previous Owner | Dinh Cuong | $70,400 | |
| Previous Owner | Dinh Cuong | $281,600 |
Source: Public Records
Tax History Compared to Growth
Tax History
| Year | Tax Paid | Tax Assessment Tax Assessment Total Assessment is a certain percentage of the fair market value that is determined by local assessors to be the total taxable value of land and additions on the property. | Land | Improvement |
|---|---|---|---|---|
| 2024 | $5,959 | $739,395 | $287,198 | $452,197 |
| 2023 | $5,959 | $765,830 | $297,466 | $468,364 |
| 2022 | $4,882 | $651,774 | $253,164 | $398,610 |
| 2021 | $4,538 | $525,638 | $204,170 | $321,468 |
| 2020 | $4,456 | $461,082 | $179,095 | $281,987 |
| 2019 | $4,069 | $437,667 | $170,000 | $267,667 |
| 2018 | $4,224 | $400,632 | $141,050 | $259,582 |
| 2017 | $3,722 | $355,618 | $125,200 | $230,418 |
| 2016 | $3,391 | $327,503 | $115,200 | $212,303 |
| 2015 | $3,338 | $310,634 | $109,200 | $201,434 |
| 2014 | -- | $295,834 | $104,000 | $191,834 |
| 2013 | -- | $281,146 | $100,000 | $181,146 |
Source: Public Records
Map
Nearby Homes
- 802 39th Place
- 809 40th St
- 835 Samish Way
- 1000 Samish Way
- 3605 Mill Ave
- 921 Whitewater Dr
- 820 32nd St
- 700 32nd St Unit A408
- 700 32nd St Unit A412
- 4224 Dumas Ave
- 690 32nd St Unit B205
- 1615 Samish Way
- 3104 Bill McDonald Pkwy Unit D-104
- 3100 Bill McDonald Pkwy Unit E302
- 1800 40th Place
- 3104 Wilson Ave
- 3405 3407 Consolidation Ave
- 923 24th St
- 2010 Samish Crest Way
- 2694 Donovan Ave Unit 32