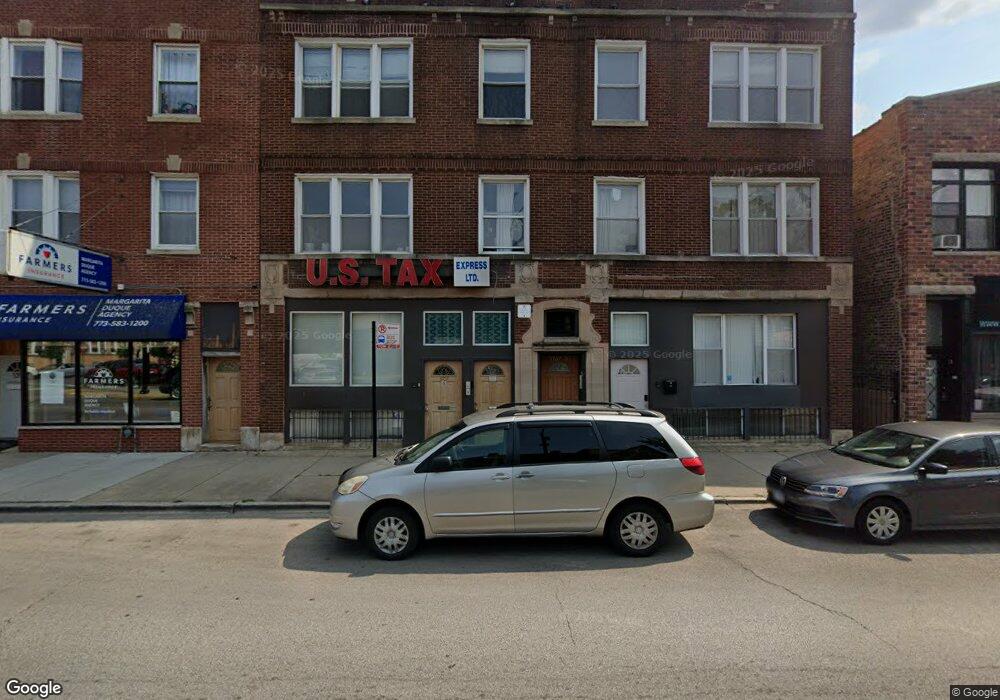
3707 W Montrose Ave Unit 37071 Chicago, IL 60618
Irving Park NeighborhoodEstimated Value: $249,000 - $300,000
2
Beds
2
Baths
1,200
Sq Ft
$226/Sq Ft
Est. Value
About This Home
This home is located at 3707 W Montrose Ave Unit 37071, Chicago, IL 60618 and is currently estimated at $271,750, approximately $226 per square foot. 3707 W Montrose Ave Unit 37071 is a home located in Cook County with nearby schools including Haugan Elementary School, Roosevelt High School, and ASPIRA Haugan Middle School.
Ownership History
Date
Name
Owned For
Owner Type
Purchase Details
Closed on
Jan 4, 2018
Sold by
Boatright Monty S
Bought by
Ramirez Jennifer
Current Estimated Value
Home Financials for this Owner
Home Financials are based on the most recent Mortgage that was taken out on this home.
Original Mortgage
$179,450
Outstanding Balance
$152,125
Interest Rate
4.12%
Mortgage Type
New Conventional
Estimated Equity
$119,625
Purchase Details
Closed on
Dec 15, 2015
Sold by
Michalache Pierro
Bought by
Montrose Land Trust
Purchase Details
Closed on
Sep 5, 2014
Sold by
U S Tax Express Ltd
Bought by
Mihalache Pierro
Purchase Details
Closed on
Jan 31, 2005
Sold by
Abc Construction & Heating Inc
Bought by
Bahl Rohini and Aspacio Jennifer
Home Financials for this Owner
Home Financials are based on the most recent Mortgage that was taken out on this home.
Original Mortgage
$175,200
Interest Rate
5.12%
Mortgage Type
Purchase Money Mortgage
Create a Home Valuation Report for This Property
The Home Valuation Report is an in-depth analysis detailing your home's value as well as a comparison with similar homes in the area
Home Values in the Area
Average Home Value in this Area
Purchase History
| Date | Buyer | Sale Price | Title Company |
|---|---|---|---|
| Ramirez Jennifer | $185,000 | Heritage Title Company | |
| Montrose Land Trust | -- | None Available | |
| Mihalache Pierro | $55,000 | Heritage Title Company | |
| Bahl Rohini | $219,000 | Pntn |
Source: Public Records
Mortgage History
| Date | Status | Borrower | Loan Amount |
|---|---|---|---|
| Open | Ramirez Jennifer | $179,450 | |
| Previous Owner | Bahl Rohini | $175,200 | |
| Closed | Bahl Rohini | $43,800 |
Source: Public Records
Tax History Compared to Growth
Tax History
| Year | Tax Paid | Tax Assessment Tax Assessment Total Assessment is a certain percentage of the fair market value that is determined by local assessors to be the total taxable value of land and additions on the property. | Land | Improvement |
|---|---|---|---|---|
| 2024 | $3,009 | $18,079 | $3,683 | $14,396 |
| 2023 | $2,933 | $14,212 | $3,282 | $10,930 |
| 2022 | $2,933 | $14,212 | $3,282 | $10,930 |
| 2021 | $2,867 | $14,211 | $3,282 | $10,929 |
| 2020 | $2,805 | $12,547 | $1,306 | $11,241 |
| 2019 | $3,113 | $15,444 | $1,306 | $14,138 |
| 2018 | $3,061 | $15,444 | $1,306 | $14,138 |
| 2017 | $1,778 | $8,233 | $1,187 | $7,046 |
| 2016 | $1,655 | $8,233 | $1,187 | $7,046 |
| 2015 | $1,514 | $8,233 | $1,187 | $7,046 |
| 2014 | $2,136 | $11,473 | $1,069 | $10,404 |
| 2013 | $2,094 | $11,473 | $1,069 | $10,404 |
Source: Public Records
Map
Nearby Homes
- 3733 W Sunnyside Ave
- 4304 N Lawndale Ave
- 3816 W Montrose Ave
- 3707 W Cullom Ave Unit 1
- 3550 W Montrose Ave Unit 107
- 4515 N Hamlin Ave
- 4426 N Drake Ave
- 4249 N Central Park Ave
- 4619 N Lawndale Ave Unit 1
- 4621 N Monticello Ave
- 4416 N Harding Ave Unit 3
- 4534 N Saint Louis Ave
- 4207 N Drake Ave
- 4203 N Drake Ave
- 4602 N Springfield Ave
- 4115 N Ridgeway Ave
- 4614 N Springfield Ave
- 4103 N Lawndale Ave Unit 202
- 4143 N Drake Ave
- 4624 N Springfield Ave
- 3707 W Montrose Ave Unit 1
- 3707 W Montrose Ave Unit 37073
- 3707 W Montrose Ave Unit 37072
- 3707 W Montrose Ave Unit 2
- 3707 W Montrose Ave Unit G
- 3707 W Montrose Ave Unit 3
- 3709 W Montrose Ave Unit P12
- 3709 W Montrose Ave Unit P11
- 3709 W Montrose Ave Unit P7
- 3709 W Montrose Ave Unit P5
- 3709 W Montrose Ave Unit P4
- 3709 W Montrose Ave Unit P3
- 3709 W Montrose Ave Unit P2
- 3709 W Montrose Ave Unit P1
- 3709 W Montrose Ave Unit 37093
- 3709 W Montrose Ave Unit 37092
- 3709 W Montrose Ave Unit 37091
- 3709 W Montrose Ave Unit 3709G
- 3709 W Montrose Ave Unit P8
- 3709 W Montrose Ave Unit P9