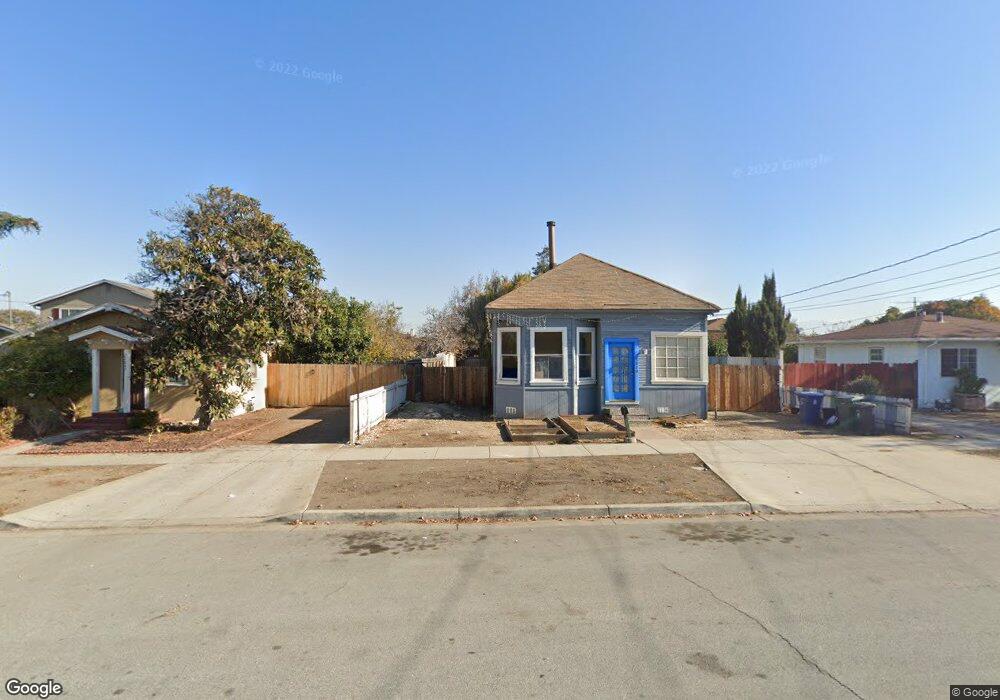
37070 Locust St Newark, CA 94560
Estimated Value: $711,000 - $892,000
2
Beds
1
Bath
1,023
Sq Ft
$804/Sq Ft
Est. Value
About This Home
This home is located at 37070 Locust St, Newark, CA 94560 and is currently estimated at $822,231, approximately $803 per square foot. 37070 Locust St is a home located in Alameda County with nearby schools including August Schilling Elementary School, Newark Junior High School, and Newark Memorial High School.
Ownership History
Date
Name
Owned For
Owner Type
Purchase Details
Closed on
Dec 20, 2023
Sold by
Rajesh And Sushila Singh Living Trust
Bought by
Ram Jaynish Daniel and Ram Monica Singh
Current Estimated Value
Purchase Details
Closed on
Dec 1, 2007
Sold by
Singh Rajesh C and Singh Sushila
Bought by
The Rajesh & Sushila Singh Living Trust
Purchase Details
Closed on
Apr 13, 1999
Sold by
Emmett Gerald W and Emmett Carol A
Bought by
Singh Rajesh C and Singh Sushilla W
Home Financials for this Owner
Home Financials are based on the most recent Mortgage that was taken out on this home.
Original Mortgage
$136,000
Interest Rate
7.1%
Purchase Details
Closed on
Dec 7, 1998
Sold by
Davenport Glenn
Bought by
Davenport Tamara Lynn
Purchase Details
Closed on
Dec 19, 1997
Sold by
Emmett Gerald W and Emmett Carol A
Bought by
Allen Emmett George Peter and Allen Emmett Roger
Create a Home Valuation Report for This Property
The Home Valuation Report is an in-depth analysis detailing your home's value as well as a comparison with similar homes in the area
Home Values in the Area
Average Home Value in this Area
Purchase History
| Date | Buyer | Sale Price | Title Company |
|---|---|---|---|
| Ram Jaynish Daniel | -- | None Listed On Document | |
| The Rajesh & Sushila Singh Living Trust | -- | None Available | |
| Singh Rajesh C | $170,000 | Chicago Title Co | |
| Davenport Tamara Lynn | -- | Chicago Title Co | |
| Emmett Roger Allen | -- | Chicago Title Co | |
| Allen Emmett George Peter | -- | -- | |
| Emmett Gerald Wayne | -- | -- |
Source: Public Records
Mortgage History
| Date | Status | Borrower | Loan Amount |
|---|---|---|---|
| Previous Owner | Singh Rajesh C | $136,000 |
Source: Public Records
Tax History Compared to Growth
Tax History
| Year | Tax Paid | Tax Assessment Tax Assessment Total Assessment is a certain percentage of the fair market value that is determined by local assessors to be the total taxable value of land and additions on the property. | Land | Improvement |
|---|---|---|---|---|
| 2025 | $3,770 | $765,000 | $612,000 | $153,000 |
| 2024 | $3,770 | $261,271 | $153,689 | $107,582 |
| 2023 | $3,654 | $256,149 | $150,676 | $105,473 |
| 2022 | $3,587 | $251,127 | $147,722 | $103,405 |
| 2021 | $3,503 | $246,204 | $144,826 | $101,378 |
| 2020 | $3,398 | $243,679 | $143,341 | $100,338 |
| 2019 | $3,354 | $238,902 | $140,531 | $98,371 |
| 2018 | $3,300 | $234,219 | $137,776 | $96,443 |
| 2017 | $3,217 | $229,627 | $135,075 | $94,552 |
| 2016 | $3,172 | $225,125 | $132,427 | $92,698 |
| 2015 | $3,161 | $221,744 | $130,438 | $91,306 |
| 2014 | $3,071 | $217,401 | $127,883 | $89,518 |
Source: Public Records
Map
Nearby Homes
- 7843 Railroad Ave
- 37051 Walnut St
- 36985 Walnut St
- 36563 Beutke Dr
- 36702 Olive St
- 37136 Magnolia St
- 36535 Mulberry St
- 36976 Mulberry St
- 37282 Magnolia St
- 36466 Haley St
- 8360 Marine Way
- 36523 Cherry St
- 6364 Noel Ave
- 37356 Suncrest St
- 37561 Breakers Rd
- 36593 Leone St
- 6278 Dairy Ave
- 8512 Bayshores Ave
- 8629 Seawind Way
- 6153 Thornton Ave Unit D
- 37062 Locust St
- 37078 Locust St
- 37054 Locust St Unit ABC
- 37086 Locust St
- 37079 Elm St
- 37046 Locust St
- 37073 Elm St
- 37087 Elm St
- 37063 Elm St
- 37093 Elm St
- 37055 Elm St
- 37085 Locust St
- 37073 Locust St
- 37061 Locust St
- 37047 Elm St
- 37030 Locust St
- 37053 Locust St
- 37045 Locust St
- 37037 Locust St
- 37022 Locust St