Estimated Value: $441,000 - $558,000
5
Beds
3
Baths
1,704
Sq Ft
$292/Sq Ft
Est. Value
About This Home
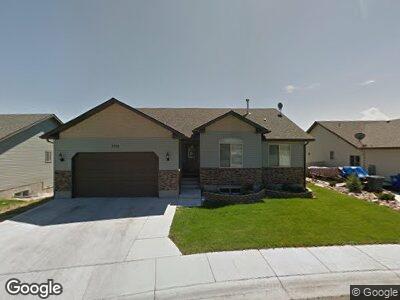
This home is located at 3708 Enfield Ave, Elko, NV 89801 and is currently estimated at $498,320, approximately $292 per square foot. 3708 Enfield Ave is a home with nearby schools including Mountain View Elementary School, Adobe Middle School, and Flagview Intermediate School.
Ownership History
Date
Name
Owned For
Owner Type
Purchase Details
Closed on
Oct 26, 2020
Sold by
Larsen Robert C
Bought by
Larsen Stephanie O and Larsen Robert C
Current Estimated Value
Home Financials for this Owner
Home Financials are based on the most recent Mortgage that was taken out on this home.
Original Mortgage
$251,000
Outstanding Balance
$228,889
Interest Rate
2.8%
Mortgage Type
New Conventional
Purchase Details
Closed on
Apr 30, 2013
Sold by
Larsen Robert C
Bought by
Larsen Stephanie O and Larsen Robert O
Home Financials for this Owner
Home Financials are based on the most recent Mortgage that was taken out on this home.
Original Mortgage
$16,500
Interest Rate
3.54%
Mortgage Type
Credit Line Revolving
Purchase Details
Closed on
Mar 29, 2012
Sold by
Brookwood Development Llc
Bought by
Larsen Robert C
Home Financials for this Owner
Home Financials are based on the most recent Mortgage that was taken out on this home.
Original Mortgage
$247,241
Interest Rate
3.79%
Mortgage Type
New Conventional
Create a Home Valuation Report for This Property
The Home Valuation Report is an in-depth analysis detailing your home's value as well as a comparison with similar homes in the area
Home Values in the Area
Average Home Value in this Area
Purchase History
| Date | Buyer | Sale Price | Title Company |
|---|---|---|---|
| Larsen Stephanie O | -- | None Available | |
| Larsen Stephanie O | -- | None Available | |
| Larsen Robert C | $309,500 | Stewart Title Elko |
Source: Public Records
Mortgage History
| Date | Status | Borrower | Loan Amount |
|---|---|---|---|
| Open | Larsen Stephanie O | $251,000 | |
| Closed | Larsen Stephanie O | $16,500 | |
| Previous Owner | Larsen Robert C | $247,241 |
Source: Public Records
Tax History Compared to Growth
Tax History
| Year | Tax Paid | Tax Assessment Tax Assessment Total Assessment is a certain percentage of the fair market value that is determined by local assessors to be the total taxable value of land and additions on the property. | Land | Improvement |
|---|---|---|---|---|
| 2024 | $5,023 | $147,911 | $17,500 | $130,411 |
| 2023 | $4,589 | $118,165 | $17,500 | $100,665 |
| 2022 | $3,699 | $102,682 | $17,500 | $85,182 |
| 2021 | $3,591 | $100,169 | $17,500 | $82,669 |
| 2020 | $3,523 | $101,120 | $17,500 | $83,620 |
| 2019 | $3,484 | $100,032 | $17,500 | $82,532 |
| 2018 | $3,448 | $100,034 | $17,500 | $82,534 |
| 2017 | $3,347 | $98,318 | $17,500 | $80,818 |
| 2016 | $3,250 | $94,533 | $17,500 | $77,033 |
| 2015 | $3,154 | $92,281 | $17,500 | $74,781 |
| 2014 | $3,028 | $88,295 | $17,500 | $70,795 |
Source: Public Records
Map
Nearby Homes
- 0 N 5th St
- 304 Rolling Hills Dr
- 222 Rolling Hills Dr
- 3706 Valley Ridge Ave
- 3534 Hawthorne Dr
- 9999 5th St
- 317 Forest Ln
- 211 Copper St
- 2041 Eagle Ridge Loop Unit 11
- 2045 Eagle Ridge Loop Unit 12
- 2611 Platinum Dr
- 2617 Platinum Dr
- 2619 Platinum Dr
- 2616 Platinum Dr
- 2489 5th St
- 2477 5th St
- 2473 5th St
- 2461 5th St
- 425 Cottonwood Dr
- 2449 5th St
- 3708 Enfield Ave
- 3712 Enfield Ave
- 3704 Enfield Ave
- 222 Brookwood Dr
- 3716 Enfield Ave
- 222 Brookwood Dr
- 369 Garrett Ct
- 366 Garrett Ct
- 3711 Enfield Ave
- 304 Brookwood Dr
- 304 Brookwood Dr
- 3720 Enfield Ave
- 3715 Enfield Ave
- 218 Brookwood Dr
- 3608 Enfield Ave
- 3719 Enfield Ave
- 225 Brookwood Dr
- 3724 Enfield Ave
- 3708 Braden Way
- 3712 Braden Way