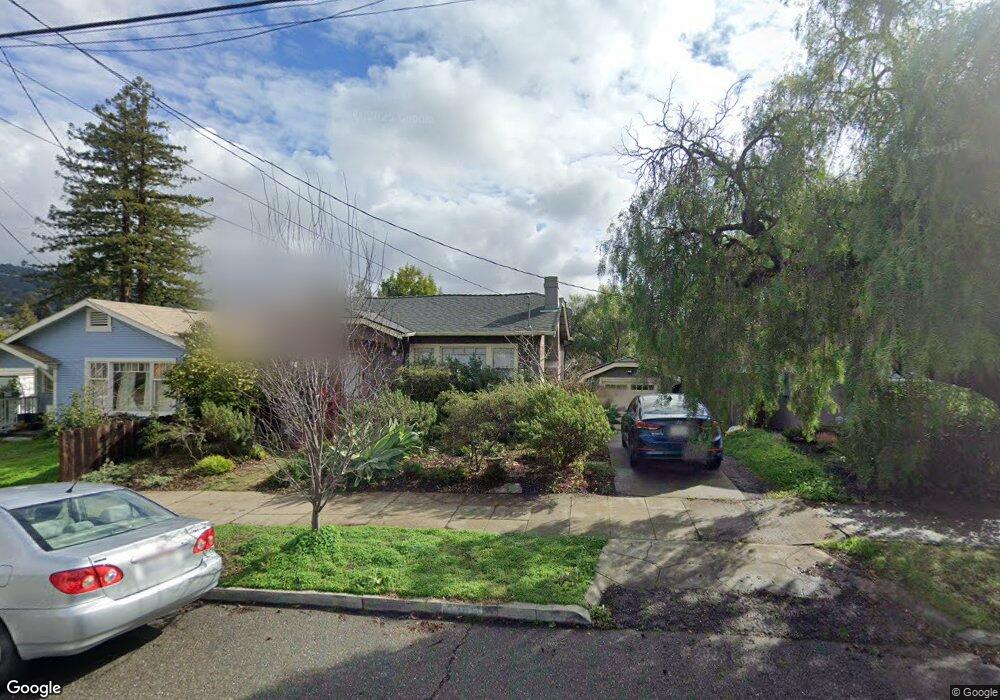
3708 Rhoda Ave Oakland, CA 94602
Dimond District NeighborhoodEstimated Value: $667,000 - $841,000
2
Beds
1
Bath
--
Sq Ft
6,098
Sq Ft Lot
About This Home
This home is located at 3708 Rhoda Ave, Oakland, CA 94602 and is currently estimated at $771,041. 3708 Rhoda Ave is a home located in Alameda County with nearby schools including Sequoia Elementary School, Bret Harte Middle School, and Skyline High School.
Ownership History
Date
Name
Owned For
Owner Type
Purchase Details
Closed on
Jun 9, 2020
Sold by
Burrows Lorraine M and The Lorraine M Burrows Trust
Bought by
Burrows Jonathan
Current Estimated Value
Purchase Details
Closed on
May 11, 2007
Sold by
Burrows Harry L and Burrows Lorraine M
Bought by
Burrows Lorraine M and Lorraine M Burrows Trust
Purchase Details
Closed on
Apr 9, 1998
Sold by
Contier Leonilde Family Trust and Angelo Contier E
Bought by
Burrows Harry L and Burrows Lorraine M
Home Financials for this Owner
Home Financials are based on the most recent Mortgage that was taken out on this home.
Original Mortgage
$129,600
Outstanding Balance
$24,774
Interest Rate
7.18%
Estimated Equity
$746,267
Purchase Details
Closed on
May 23, 1995
Sold by
Contier Leonilde
Bought by
Contier Leonilde and Contier Angelo
Purchase Details
Closed on
Mar 31, 1995
Sold by
Contier Angelo and Contier John
Bought by
Contier Leonilde
Create a Home Valuation Report for This Property
The Home Valuation Report is an in-depth analysis detailing your home's value as well as a comparison with similar homes in the area
Home Values in the Area
Average Home Value in this Area
Purchase History
| Date | Buyer | Sale Price | Title Company |
|---|---|---|---|
| Burrows Jonathan | -- | None Available | |
| Burrows Lorraine M | -- | None Available | |
| Burrows Harry L | $162,000 | First American Title Guarant | |
| Contier Leonilde | -- | -- | |
| Contier Leonilde | -- | -- |
Source: Public Records
Mortgage History
| Date | Status | Borrower | Loan Amount |
|---|---|---|---|
| Open | Burrows Harry L | $129,600 |
Source: Public Records
Tax History Compared to Growth
Tax History
| Year | Tax Paid | Tax Assessment Tax Assessment Total Assessment is a certain percentage of the fair market value that is determined by local assessors to be the total taxable value of land and additions on the property. | Land | Improvement |
|---|---|---|---|---|
| 2025 | $5,127 | $258,660 | $77,598 | $181,062 |
| 2024 | $5,127 | $253,588 | $76,076 | $177,512 |
| 2023 | $5,285 | $248,617 | $74,585 | $174,032 |
| 2022 | $5,094 | $243,743 | $73,123 | $170,620 |
| 2021 | $4,767 | $238,964 | $71,689 | $167,275 |
| 2020 | $4,712 | $236,514 | $70,954 | $165,560 |
| 2019 | $4,470 | $231,878 | $69,563 | $162,315 |
| 2018 | $4,377 | $227,332 | $68,199 | $159,133 |
| 2017 | $4,186 | $222,875 | $66,862 | $156,013 |
| 2016 | $3,985 | $218,507 | $65,552 | $152,955 |
| 2015 | $3,959 | $215,224 | $64,567 | $150,657 |
| 2014 | $3,879 | $211,008 | $63,302 | $147,706 |
Source: Public Records
Map
Nearby Homes
- 2726 Madeline St
- 2715 Macarthur Blvd
- 3853 Rhoda Ave
- 3873 Coolidge Ave
- 3875 Coolidge Ave
- 2941 Madeline St
- 2958 Georgia St
- 2954 Delaware St
- 2808 Carmel St
- 3019 Florida St
- 2510 Delmer St
- 3826 Lincoln Ave
- 3477 Boston Ave Unit 4
- 3316 Coolidge Ave
- 3055 Kansas St
- 3531 Laurel Ave
- 3464 Champion St
- 4019 Rhoda Ave
- 2240 Macarthur Blvd
- 3720 Rhoda Ave
- 3704 Rhoda Ave
- 3726 Rhoda Ave
- 3652 Rhoda Ave
- 3721 Coolidge Ave
- 3711 Coolidge Ave
- 3738 Rhoda Ave
- 3646 Rhoda Ave
- 3725 Coolidge Ave
- 3731 Coolidge Ave
- 3707 Coolidge Ave
- 3711 Rhoda Ave
- 3719 Rhoda Ave
- 3703 Rhoda Ave
- 3737 Coolidge Ave
- 3701 Coolidge Ave
- 2701 Madeline St
- 3636 Rhoda Ave
- 3729 Rhoda Ave
- 3653 Rhoda Ave