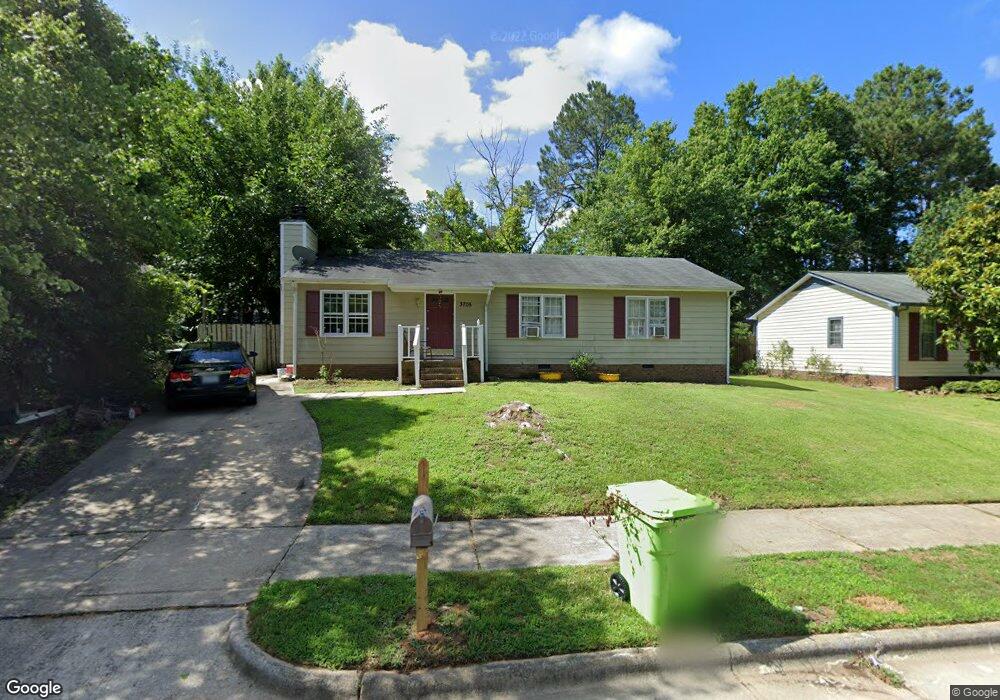
3708 Summer Place Raleigh, NC 27604
Northeast Raleigh NeighborhoodEstimated Value: $267,961 - $284,000
3
Beds
2
Baths
1,163
Sq Ft
$238/Sq Ft
Est. Value
About This Home
This home is located at 3708 Summer Place, Raleigh, NC 27604 and is currently estimated at $276,490, approximately $237 per square foot. 3708 Summer Place is a home located in Wake County with nearby schools including Wilburn Elementary, Durant Road Middle, and Heritage High School.
Ownership History
Date
Name
Owned For
Owner Type
Purchase Details
Closed on
Oct 17, 2012
Bought by
Zepeda Jose R Mejia and Zepeda-Pastrana Dora
Current Estimated Value
Purchase Details
Closed on
Jan 23, 2012
Sold by
Secretary Of Housing & Urban Development
Bought by
Chen Yanshu
Purchase Details
Closed on
Aug 26, 2011
Sold by
Jpmorgan Chase Bank National Association
Bought by
Secretary Of Housing & Urban Development
Purchase Details
Closed on
Jun 23, 2011
Sold by
Simmons Latham
Bought by
Jpmorgan Chase Bank National Association
Purchase Details
Closed on
May 5, 2011
Sold by
Simmons Latham
Bought by
Chase Home Finance Llc
Purchase Details
Closed on
Feb 29, 2000
Sold by
Beard Gary L and Beard Rebecca S
Bought by
Simmons Jr Latham
Home Financials for this Owner
Home Financials are based on the most recent Mortgage that was taken out on this home.
Original Mortgage
$93,850
Interest Rate
8.21%
Create a Home Valuation Report for This Property
The Home Valuation Report is an in-depth analysis detailing your home's value as well as a comparison with similar homes in the area
Home Values in the Area
Average Home Value in this Area
Purchase History
| Date | Buyer | Sale Price | Title Company |
|---|---|---|---|
| Zepeda Jose R Mejia | $102,000 | -- | |
| Chen Yanshu | -- | None Available | |
| Secretary Of Housing & Urban Development | -- | None Available | |
| Jpmorgan Chase Bank National Association | $104,508 | None Available | |
| Chase Home Finance Llc | $104,508 | None Available | |
| Simmons Jr Latham | $97,000 | -- |
Source: Public Records
Mortgage History
| Date | Status | Borrower | Loan Amount |
|---|---|---|---|
| Previous Owner | Simmons Jr Latham | $93,850 |
Source: Public Records
Tax History Compared to Growth
Tax History
| Year | Tax Paid | Tax Assessment Tax Assessment Total Assessment is a certain percentage of the fair market value that is determined by local assessors to be the total taxable value of land and additions on the property. | Land | Improvement |
|---|---|---|---|---|
| 2025 | $2,098 | $238,315 | $95,000 | $143,315 |
| 2024 | $2,090 | $238,315 | $95,000 | $143,315 |
| 2023 | $1,663 | $150,696 | $40,000 | $110,696 |
| 2022 | $1,546 | $150,696 | $40,000 | $110,696 |
| 2021 | $1,486 | $150,696 | $40,000 | $110,696 |
| 2020 | $1,459 | $150,696 | $40,000 | $110,696 |
| 2019 | $1,395 | $118,658 | $34,000 | $84,658 |
| 2018 | $1,316 | $118,658 | $34,000 | $84,658 |
| 2017 | $1,254 | $118,658 | $34,000 | $84,658 |
| 2016 | $1,229 | $118,658 | $34,000 | $84,658 |
| 2015 | $1,285 | $122,199 | $38,000 | $84,199 |
| 2014 | $1,220 | $122,199 | $38,000 | $84,199 |
Source: Public Records
Map
Nearby Homes
- 3700 Summer Place
- 3912 Summer Place
- 3735 Bison Hill Ln
- 3607 Buffaloe Rd
- 3749 Bison Hill Ln
- 3721 Baugh St
- 3635 Water Mist Ln
- 3636 Water Mist Ln
- 3605 Satellite Ct
- 4200 James
- 4106 N New Hope Rd
- 4236 Lake Ridge Dr Unit 11B
- 4361 Bona Ct
- 3936 Iron Horse Rd
- 4376 Bona Ct
- 4217 James Rd
- 4317 Woodlawn Dr
- 4208 Reddington Trail
- 3701 Saratoga Dr
- 4463 Roller Ct
- 3712 Summer Place
- 3704 Summer Place
- 3709 Dusty Ln
- 3713 Dusty Ln
- 3705 Dusty Ln
- 3716 Summer Place
- 3709 Summer Place
- 3705 Summer Place
- 3713 Summer Place
- 3717 Dusty Ln
- 3701 Dusty Ln
- 3720 Summer Place
- 3717 Summer Place
- 3701 Summer Place
- 3721 Dusty Ln
- 3708 Dusty Ln
- 3721 Summer Place
- 3704 Dusty Ln
- 3712 Dusty Ln
- 3724 Summer Place