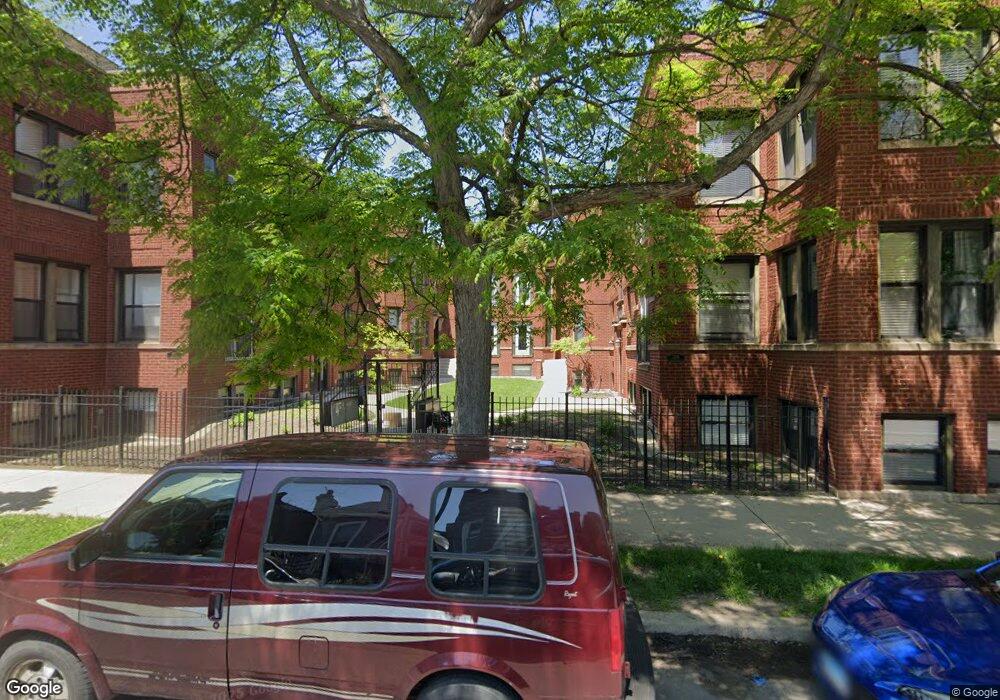
3708 W Wrightwood Ave Unit 2F Chicago, IL 60647
Logan Square NeighborhoodEstimated Value: $214,000 - $307,000
--
Bed
--
Bath
20,094
Sq Ft
$13/Sq Ft
Est. Value
About This Home
This home is located at 3708 W Wrightwood Ave Unit 2F, Chicago, IL 60647 and is currently estimated at $259,168, approximately $12 per square foot. 3708 W Wrightwood Ave Unit 2F is a home located in Cook County with nearby schools including Monroe Elementary School, Kelvyn Park High School, and Aspira Business & Finance High School.
Ownership History
Date
Name
Owned For
Owner Type
Purchase Details
Closed on
Nov 10, 2011
Sold by
Federal Home Loan Mortgage Corporation
Bought by
Cacal Charissa
Current Estimated Value
Home Financials for this Owner
Home Financials are based on the most recent Mortgage that was taken out on this home.
Original Mortgage
$64,350
Outstanding Balance
$44,092
Interest Rate
4.12%
Mortgage Type
New Conventional
Estimated Equity
$215,076
Purchase Details
Closed on
Jun 20, 2011
Sold by
Cassel Rebecca
Bought by
Federal Home Loan Mortgage Corp
Purchase Details
Closed on
Apr 6, 2006
Sold by
Mg Suneside Development Llc
Bought by
Cassel Rebecca
Home Financials for this Owner
Home Financials are based on the most recent Mortgage that was taken out on this home.
Original Mortgage
$174,800
Interest Rate
6.37%
Mortgage Type
Fannie Mae Freddie Mac
Purchase Details
Closed on
Aug 8, 2005
Sold by
Gaj Michal
Bought by
Mg Suneside Development Llc
Create a Home Valuation Report for This Property
The Home Valuation Report is an in-depth analysis detailing your home's value as well as a comparison with similar homes in the area
Home Values in the Area
Average Home Value in this Area
Purchase History
| Date | Buyer | Sale Price | Title Company |
|---|---|---|---|
| Cacal Charissa | $71,500 | Attorneys Title Guaranty Fun | |
| Federal Home Loan Mortgage Corp | -- | None Available | |
| Cassel Rebecca | $218,500 | Stewart Title Of Illinois | |
| Mg Suneside Development Llc | -- | Cti |
Source: Public Records
Mortgage History
| Date | Status | Borrower | Loan Amount |
|---|---|---|---|
| Open | Cacal Charissa | $64,350 | |
| Previous Owner | Cassel Rebecca | $174,800 |
Source: Public Records
Tax History Compared to Growth
Tax History
| Year | Tax Paid | Tax Assessment Tax Assessment Total Assessment is a certain percentage of the fair market value that is determined by local assessors to be the total taxable value of land and additions on the property. | Land | Improvement |
|---|---|---|---|---|
| 2024 | $3,599 | $24,129 | $2,942 | $21,187 |
| 2023 | $3,508 | $17,000 | $2,367 | $14,633 |
| 2022 | $3,508 | $17,000 | $2,367 | $14,633 |
| 2021 | $3,430 | $16,999 | $2,366 | $14,633 |
| 2020 | $3,548 | $15,868 | $1,081 | $14,787 |
| 2019 | $3,581 | $17,758 | $1,081 | $16,677 |
| 2018 | $3,508 | $17,758 | $1,081 | $16,677 |
| 2017 | $3,615 | $16,792 | $946 | $15,846 |
| 2016 | $3,363 | $16,792 | $946 | $15,846 |
| 2015 | $3,077 | $16,792 | $946 | $15,846 |
| 2014 | $2,852 | $15,371 | $811 | $14,560 |
| 2013 | $2,796 | $15,371 | $811 | $14,560 |
Source: Public Records
Map
Nearby Homes
- 2506 N Monticello Ave
- 2706 N Monticello Ave
- 3707 W Altgeld St Unit 1
- 2736 N Monticello Ave
- 2633 N Springfield Ave
- 2435 N Monticello Ave
- 2521 N Springfield Ave
- 2742 N Hamlin Ave Unit 3N
- 3601 W Diversey Ave
- 2343 N Lawndale Ave
- 2837 N Ridgeway Ave
- 2342 N Hamlin Ave
- 2439 N Harding Ave
- 2323 N Monticello Ave
- 2836 N Drake Ave
- 2733 N Pulaski Rd
- 2857 N Avers Ave
- 2512 N Kimball Ave
- 2628 N Spaulding Ave Unit 1
- 3547 W Belden Ave
- 3710 W Wrightwood Ave Unit 2E
- 3708 W Wrightwood Ave Unit 2E
- 3708 W Wrightwood Ave Unit 2D
- 3708 W Wrightwood Ave Unit 2A
- 3708 W Wrightwood Ave Unit 1E
- 3708 W Wrightwood Ave Unit 2B
- 3708 W Wrightwood Ave Unit 1F
- 3708 W Wrightwood Ave Unit 3F
- 3708 W Wrightwood Ave Unit 3B
- 3708 W Wrightwood Ave Unit 3A
- 3710 W Wrightwood Ave Unit 3E
- 3708 W Wrightwood Ave Unit 3D
- 3708 W Wrightwood Ave Unit 2C
- 3710 W Wrightwood Ave Unit 2D
- 3710 W Wrightwood Ave Unit 3-D
- 3708 W Wrightwood Ave Unit 1B
- 3710 W Wrightwood Ave Unit 1E
- 3706 W Wrightwood Ave Unit 1A
- 3706 W Wrightwood Ave Unit 1B
- 3706 W Wrightwood Ave Unit 2A