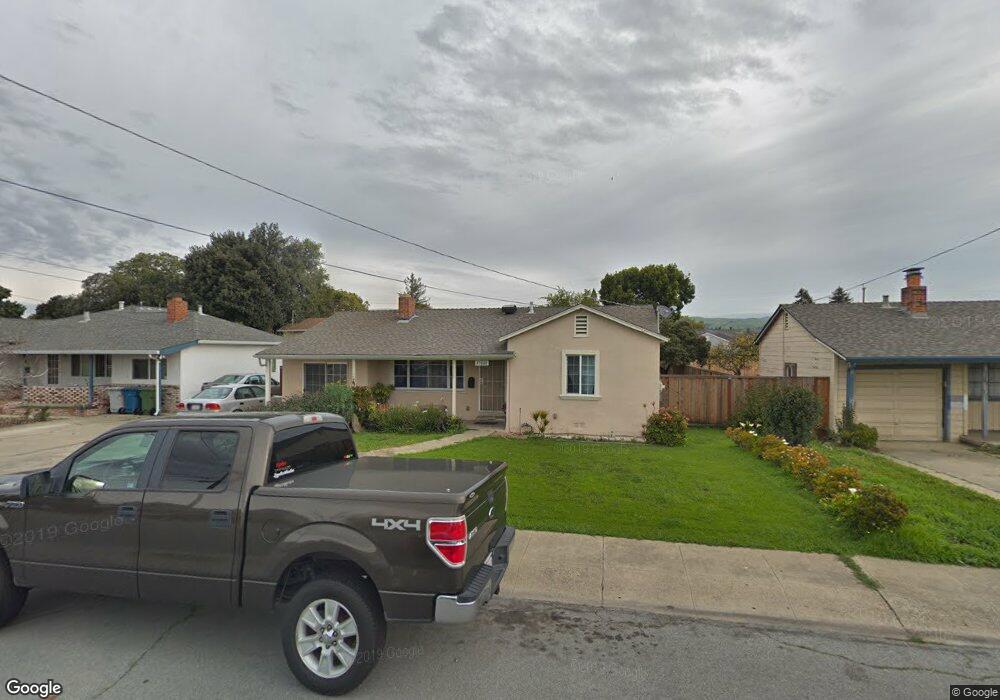
37088 Holly St Fremont, CA 94536
Centerville District NeighborhoodEstimated Value: $1,146,000 - $1,526,000
3
Beds
3
Baths
1,421
Sq Ft
$946/Sq Ft
Est. Value
About This Home
This home is located at 37088 Holly St, Fremont, CA 94536 and is currently estimated at $1,344,018, approximately $945 per square foot. 37088 Holly St is a home located in Alameda County with nearby schools including Oliveira Elementary School, Thornton Middle School, and American High School.
Ownership History
Date
Name
Owned For
Owner Type
Purchase Details
Closed on
Sep 27, 2021
Sold by
Chuang Tatoa and Chi Wenlan
Bought by
Chuang Tatoa and Chi Wenlan
Current Estimated Value
Purchase Details
Closed on
Jan 12, 2012
Sold by
Us Bank National Association
Bought by
Chuang Tatoa and Chi Wenlan
Purchase Details
Closed on
Aug 31, 2011
Sold by
Sandoval Huynh Ha Thanh and Sandoval Torres Francisco
Bought by
U S Bank National Association
Purchase Details
Closed on
Sep 2, 2008
Sold by
Torres Francisco Sandoval
Bought by
Huynh Ha Thanh
Purchase Details
Closed on
Mar 23, 2005
Sold by
Broski John and Broski 1990 Trust
Bought by
Torres Francisco Sandoval and Huynh Ha Thanh
Home Financials for this Owner
Home Financials are based on the most recent Mortgage that was taken out on this home.
Original Mortgage
$464,000
Interest Rate
1%
Mortgage Type
Negative Amortization
Create a Home Valuation Report for This Property
The Home Valuation Report is an in-depth analysis detailing your home's value as well as a comparison with similar homes in the area
Home Values in the Area
Average Home Value in this Area
Purchase History
| Date | Buyer | Sale Price | Title Company |
|---|---|---|---|
| Chuang Tatoa | -- | None Available | |
| Chuang Tatoa | $315,000 | Landsafe Title Company | |
| U S Bank National Association | $355,500 | Landsafe Title | |
| Huynh Ha Thanh | -- | Chicago Title Company | |
| Torres Francisco Sandoval | $580,000 | Ticor Title Company Of Ca |
Source: Public Records
Mortgage History
| Date | Status | Borrower | Loan Amount |
|---|---|---|---|
| Previous Owner | Torres Francisco Sandoval | $464,000 | |
| Closed | Torres Francisco Sandoval | $58,000 |
Source: Public Records
Tax History Compared to Growth
Tax History
| Year | Tax Paid | Tax Assessment Tax Assessment Total Assessment is a certain percentage of the fair market value that is determined by local assessors to be the total taxable value of land and additions on the property. | Land | Improvement |
|---|---|---|---|---|
| 2025 | $5,434 | $415,338 | $175,838 | $239,500 |
| 2024 | $5,434 | $407,196 | $172,391 | $234,805 |
| 2023 | $5,278 | $399,214 | $169,012 | $230,202 |
| 2022 | $5,194 | $391,386 | $165,698 | $225,688 |
| 2021 | $5,072 | $383,714 | $162,450 | $221,264 |
| 2020 | $5,033 | $379,782 | $160,785 | $218,997 |
| 2019 | $4,979 | $372,339 | $157,634 | $214,705 |
| 2018 | $4,880 | $365,040 | $154,544 | $210,496 |
| 2017 | $4,759 | $357,885 | $151,515 | $206,370 |
| 2016 | $4,671 | $350,867 | $148,544 | $202,323 |
| 2015 | $4,601 | $345,600 | $146,314 | $199,286 |
| 2014 | $4,517 | $338,830 | $143,448 | $195,382 |
Source: Public Records
Map
Nearby Homes
- 37001 Contra Costa Ave
- 4543 Bartolo Terrace
- 4544 Thornton Ave
- 4412 Elaiso Common
- Plan 1629 at Veranda
- Plan 1165 at Veranda
- Plan 1670 at Veranda
- Plan 1455 at Veranda
- Plan 1394 at Veranda
- Plan 1725 at Veranda
- Plan 1378 at Veranda
- Plan 1657 at Veranda
- 4637 Rothbury Common
- 4632 Balboa Way
- 3663 Oakwood Terrace Unit 211
- 3751 Ruskin Place
- 3530 Oakwood Terrace Unit 102
- 3507 Buttonwood Terrace Unit 203
- 3443 Pepperwood Terrace Unit 301
- 3371 Baywood Terrace Unit 214