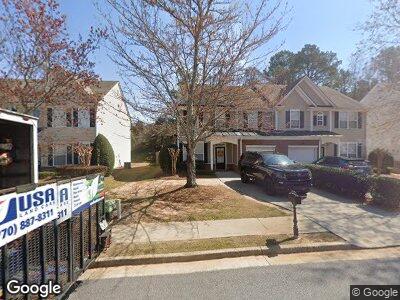
3709 Hutchinson Trace Dr Unit N/A Cumming, GA 30040
Estimated Value: $365,000 - $392,000
3
Beds
3
Baths
1,668
Sq Ft
$228/Sq Ft
Est. Value
About This Home
This home is located at 3709 Hutchinson Trace Dr Unit N/A, Cumming, GA 30040 and is currently estimated at $379,718, approximately $227 per square foot. 3709 Hutchinson Trace Dr Unit N/A is a home located in Forsyth County with nearby schools including George W. Whitlow Elementary School, Otwell Middle School, and Forsyth Central High School.
Ownership History
Date
Name
Owned For
Owner Type
Purchase Details
Closed on
Apr 25, 2023
Sold by
Singh Navdeep
Bought by
3709 Hutchinson Llc
Current Estimated Value
Purchase Details
Closed on
Feb 15, 2022
Sold by
Urban Estates Group Llc
Bought by
Singh Navdeep
Purchase Details
Closed on
Nov 2, 2018
Sold by
Singh Navdeep
Bought by
Urban Estates Grp Llc
Home Financials for this Owner
Home Financials are based on the most recent Mortgage that was taken out on this home.
Original Mortgage
$145,500
Interest Rate
4.7%
Mortgage Type
New Conventional
Purchase Details
Closed on
Aug 28, 2015
Sold by
Levicki John P
Bought by
Allen Gary
Home Financials for this Owner
Home Financials are based on the most recent Mortgage that was taken out on this home.
Original Mortgage
$118,000
Interest Rate
4.02%
Mortgage Type
New Conventional
Create a Home Valuation Report for This Property
The Home Valuation Report is an in-depth analysis detailing your home's value as well as a comparison with similar homes in the area
Home Values in the Area
Average Home Value in this Area
Purchase History
| Date | Buyer | Sale Price | Title Company |
|---|---|---|---|
| Singh Navdeep | -- | Smolar Kenneth N | |
| Urban Estates Grp Llc | -- | -- | |
| Singh Navdeep | $194,000 | -- | |
| Allen Gary | $154,000 | -- | |
| Levicki John P | -- | -- |
Source: Public Records
Mortgage History
| Date | Status | Borrower | Loan Amount |
|---|---|---|---|
| Previous Owner | Singh Navdeep | $145,500 | |
| Previous Owner | Allen Gary Howard | $124,800 | |
| Previous Owner | Levicki John P | $118,000 | |
| Previous Owner | Lewicki John P | $101,000 | |
| Previous Owner | Levicki John P | $101,750 |
Source: Public Records
Tax History Compared to Growth
Tax History
| Year | Tax Paid | Tax Assessment Tax Assessment Total Assessment is a certain percentage of the fair market value that is determined by local assessors to be the total taxable value of land and additions on the property. | Land | Improvement |
|---|---|---|---|---|
| 2024 | $3,559 | $145,148 | $58,000 | $87,148 |
| 2023 | $2,989 | $121,444 | $46,000 | $75,444 |
| 2022 | $2,899 | $86,664 | $32,000 | $54,664 |
| 2021 | $2,393 | $86,664 | $32,000 | $54,664 |
| 2020 | $2,382 | $86,272 | $32,000 | $54,272 |
| 2019 | $2,146 | $77,600 | $23,080 | $54,520 |
| 2018 | $1,858 | $67,172 | $20,000 | $47,172 |
| 2017 | $1,795 | $64,680 | $20,000 | $44,680 |
| 2016 | $1,684 | $60,680 | $16,000 | $44,680 |
| 2015 | $1,608 | $57,844 | $16,000 | $41,844 |
| 2014 | -- | $46,816 | $12,000 | $34,816 |
Source: Public Records
Map
Nearby Homes
- 3615 Hutchinson Trace Dr
- 3723 Verde Glen Ln
- 3720 Werrington Dr
- 3465 Maple Valley Dr
- 358 Azalea Cir
- 290 Azalea Cir
- 3905 Delfaire Trace Unit I
- 3911 Delfaire Trace
- 1076 Firethorne Pass
- 3815 Glen Laurel Ct
- 4480 Maple Valley Dr
- 3259 Castleberry Rd
- 3315 Castleberry Rd
- 3260 Ridgefair Dr
- 3215 Trowbridge Dr
- 1775 Unity Loop
- 580 Washington Way
- 3709 Hutchinson Trace Dr
- 3709 Hutchinson Trace Dr Unit N/A
- 3705 Hutchinson Trace Dr
- 3705 Hutchinson Trace Dr
- 3711 Hutchinson Trace Dr
- 3715 Hutchinson Trace Dr
- 3703 Hutchinson Trace Dr
- 3717 Hutchinson Trace Dr Unit 22
- 3717 Hutchinson Trace Dr
- 0 Hutchinson Trace Dr Unit 3180660
- 0 Hutchinson Trace Dr Unit 7181803
- 0 Hutchinson Trace Dr Unit 22 3184378
- 0 Hutchinson Trace Dr Unit 8651339
- 0 Hutchinson Trace Dr Unit 8564193
- 0 Hutchinson Trace Dr Unit 8442439
- 0 Hutchinson Trace Dr Unit 8425437
- 0 Hutchinson Trace Dr Unit 8247130
- 0 Hutchinson Trace Dr Unit 24 8048726
- 0 Hutchinson Trace Dr
- 3627 Hutchinson Trace Dr