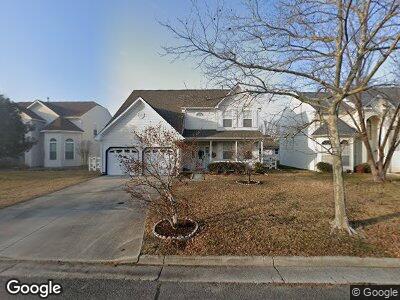
3709 Storm Bird Loop Virginia Beach, VA 23453
Green Run NeighborhoodEstimated Value: $393,000 - $518,000
4
Beds
3
Baths
2,435
Sq Ft
$194/Sq Ft
Est. Value
About This Home
This home is located at 3709 Storm Bird Loop, Virginia Beach, VA 23453 and is currently estimated at $472,713, approximately $194 per square foot. 3709 Storm Bird Loop is a home located in Virginia Beach City with nearby schools including Landstown Elementary School, Landstown Middle School, and Landstown High School.
Ownership History
Date
Name
Owned For
Owner Type
Purchase Details
Closed on
Jul 23, 2019
Sold by
Bur-Di Corporation
Bought by
Mcm Homes Corp
Current Estimated Value
Purchase Details
Closed on
Apr 11, 2016
Sold by
Carrington Mortgage Services Llc
Bought by
Bur Di Corporation
Home Financials for this Owner
Home Financials are based on the most recent Mortgage that was taken out on this home.
Original Mortgage
$191,859
Interest Rate
3.68%
Mortgage Type
Credit Line Revolving
Purchase Details
Closed on
Jan 15, 2016
Sold by
Equity Trustees Llc A Virginia Limited L and Mesa Seth L
Bought by
Carrington Mortgage Services Llc
Purchase Details
Closed on
Nov 19, 1999
Sold by
Mcq Builders & Developers
Bought by
Mesa Seth L
Home Financials for this Owner
Home Financials are based on the most recent Mortgage that was taken out on this home.
Original Mortgage
$154,151
Interest Rate
7.76%
Create a Home Valuation Report for This Property
The Home Valuation Report is an in-depth analysis detailing your home's value as well as a comparison with similar homes in the area
Home Values in the Area
Average Home Value in this Area
Purchase History
| Date | Buyer | Sale Price | Title Company |
|---|---|---|---|
| Mcm Homes Corp | -- | None Available | |
| Bur Di Corporation | $213,177 | Attorney | |
| Carrington Mortgage Services Llc | $261,000 | None Available | |
| Mesa Seth L | $156,200 | -- |
Source: Public Records
Mortgage History
| Date | Status | Borrower | Loan Amount |
|---|---|---|---|
| Previous Owner | Bur Di Corporation | $191,859 | |
| Previous Owner | Mesa Seth L | $154,151 |
Source: Public Records
Tax History Compared to Growth
Tax History
| Year | Tax Paid | Tax Assessment Tax Assessment Total Assessment is a certain percentage of the fair market value that is determined by local assessors to be the total taxable value of land and additions on the property. | Land | Improvement |
|---|---|---|---|---|
| 2024 | $4,209 | $433,900 | $160,000 | $273,900 |
| 2023 | $4,318 | $436,200 | $153,600 | $282,600 |
| 2022 | $3,856 | $389,500 | $128,000 | $261,500 |
| 2021 | $3,415 | $344,900 | $115,000 | $229,900 |
| 2020 | $3,310 | $325,300 | $107,000 | $218,300 |
| 2019 | $3,229 | $314,000 | $107,000 | $207,000 |
| 2018 | $3,148 | $314,000 | $107,000 | $207,000 |
| 2017 | $3,027 | $301,900 | $103,000 | $198,900 |
| 2016 | $2,899 | $292,800 | $100,000 | $192,800 |
| 2015 | $2,819 | $284,700 | $96,000 | $188,700 |
| 2014 | $2,491 | $284,000 | $101,700 | $182,300 |
Source: Public Records
Map
Nearby Homes
- 3612 Purebred Dr
- 3669 Purebred Dr
- 3508 Criollo Dr
- 3528 Light Horse Loop
- 1520 Saddle Ct
- 3445 Poppy Crescent
- 3416 Crimson Holly Ct
- 3400 Petunia Crescent
- 3512 Poppy Crescent
- 3309 Weeping Willow Ln
- 3321 Weeping Willow Ln
- 1728 Eleni Ct
- 1248 Gladiola Crescent
- 1521 Garland Way
- 1136 van Loen Dr
- 3513 Brigita Ct
- 1132 van Loen Dr
- 3566 Brigita Ct
- 3703 Sylvan Ln
- 3518 Argo Ct
- 3709 Storm Bird Loop
- 3705 Storm Bird Loop
- 3713 Storm Bird Loop
- 3701 Storm Bird Loop
- 3717 Storm Bird Loop
- 3708 Storm Bird Loop
- 3712 Storm Bird Loop
- 3697 Storm Bird Loop
- 3716 Storm Bird Loop
- 3585 Purebred Dr
- 3589 Purebred Dr
- 3704 Storm Bird Loop
- 3721 Storm Bird Loop
- 3581 Purebred Dr
- 3593 Purebred Dr
- 3597 Purebred Dr
- 3577 Purebred Dr
- 3693 Storm Bird Loop
- 3700 Storm Bird Loop
- 1500 Pony Ct