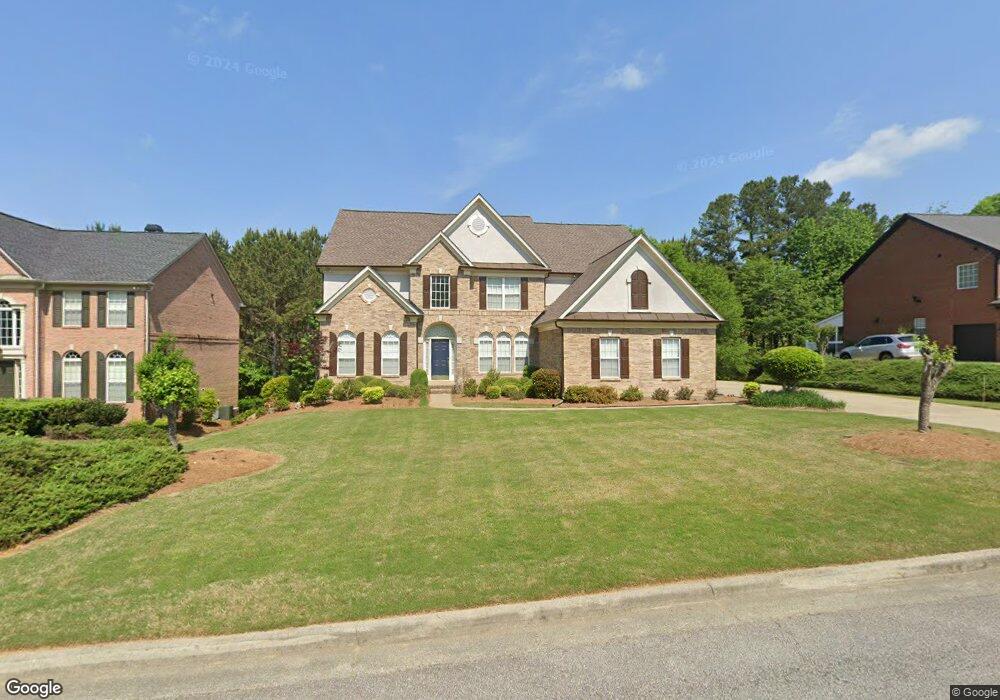
371 Bournemouth Dr Unit 1 Suwanee, GA 30024
Estimated Value: $858,229 - $1,049,000
5
Beds
4
Baths
3,905
Sq Ft
$238/Sq Ft
Est. Value
About This Home
This home is located at 371 Bournemouth Dr Unit 1, Suwanee, GA 30024 and is currently estimated at $929,807, approximately $238 per square foot. 371 Bournemouth Dr Unit 1 is a home located in Gwinnett County with nearby schools including Riverside Elementary School, North Gwinnett Middle School, and North Gwinnett High School.
Ownership History
Date
Name
Owned For
Owner Type
Purchase Details
Closed on
Jul 26, 2003
Sold by
Kim Yong W
Bought by
Kim Yong W and Kim Melony
Current Estimated Value
Home Financials for this Owner
Home Financials are based on the most recent Mortgage that was taken out on this home.
Original Mortgage
$79,000
Interest Rate
6.07%
Mortgage Type
New Conventional
Purchase Details
Closed on
Jul 26, 2002
Sold by
Kim Yong W
Bought by
Kim Yong W and Kim Melony
Home Financials for this Owner
Home Financials are based on the most recent Mortgage that was taken out on this home.
Original Mortgage
$387,000
Interest Rate
6.53%
Mortgage Type
New Conventional
Purchase Details
Closed on
Mar 9, 2001
Sold by
Park Danny
Bought by
Park Danny and Park Seoung V
Home Financials for this Owner
Home Financials are based on the most recent Mortgage that was taken out on this home.
Original Mortgage
$50,000
Interest Rate
7.02%
Mortgage Type
Credit Line Revolving
Create a Home Valuation Report for This Property
The Home Valuation Report is an in-depth analysis detailing your home's value as well as a comparison with similar homes in the area
Home Values in the Area
Average Home Value in this Area
Purchase History
| Date | Buyer | Sale Price | Title Company |
|---|---|---|---|
| Kim Yong W | -- | -- | |
| Kim Yong W | -- | -- | |
| Kim Yong W | $430,000 | -- | |
| Park Danny | -- | -- | |
| Park Danny | $475,000 | -- |
Source: Public Records
Mortgage History
| Date | Status | Borrower | Loan Amount |
|---|---|---|---|
| Previous Owner | Kim Yong W | $79,000 | |
| Previous Owner | Kim Yong W | $387,000 | |
| Previous Owner | Park Danny | $50,000 | |
| Previous Owner | Park Danny | $377,500 |
Source: Public Records
Tax History Compared to Growth
Tax History
| Year | Tax Paid | Tax Assessment Tax Assessment Total Assessment is a certain percentage of the fair market value that is determined by local assessors to be the total taxable value of land and additions on the property. | Land | Improvement |
|---|---|---|---|---|
| 2024 | $3,412 | $334,600 | $75,000 | $259,600 |
| 2023 | $3,412 | $313,720 | $75,000 | $238,720 |
| 2022 | $3,373 | $289,960 | $64,240 | $225,720 |
| 2021 | $3,366 | $218,760 | $41,200 | $177,560 |
| 2020 | $8,285 | $218,760 | $41,200 | $177,560 |
| 2019 | $7,978 | $218,760 | $41,200 | $177,560 |
| 2018 | $7,199 | $195,920 | $43,600 | $152,320 |
| 2016 | $7,211 | $195,920 | $43,600 | $152,320 |
| 2015 | $7,301 | $195,920 | $43,600 | $152,320 |
| 2014 | -- | $195,920 | $43,600 | $152,320 |
Source: Public Records
Map
Nearby Homes
- 1673 Harvest Park Ln
- 993 Harvest Park Ln
- 585 Settles Brook Ct
- 5105 Harbury Ln
- 570 White Stag Ct
- 1549 Bennett Creek Overlook
- 5224 Brendlynn Dr
- 811 Woodvale Point
- 5173 Brendlynn Dr
- 4847 Basingstoke Dr
- 861 Woodvale Point
- 790 Woodvale Point
- 891 Woodvale Point
- 5114 Brendlynn Dr NW
- 721 Woodvale Point
- 5694 Brendlynn Dr
- 5004 Gunnison Trace
- 361 Bournemouth Dr
- 381 Bournemouth Dr Unit 1
- 5350 Harbury Ln
- 5340 Harbury Ln
- 372 Bournemouth Dr
- 382 Bournemouth Dr
- 5360 Harbury Ln
- 5330 Harbury Ln Unit 1
- 392 Bournemouth Dr
- 391 Bournemouth Dr
- 351 Bournemouth Dr
- 5345 Harbury Ln
- 5320 Harbury Ln Unit 1
- 5290 Harbury Ln
- 5370 Harbury Ln
- 5323 Aldeburgh Dr Unit 203
- 5323 Aldeburgh Dr
- 1633 Harvest Park Ln
- 3908 Via Sesi Ln
- 1643 Harvest Park Ln